French vs Immigrants from Israel Unemployment Among Seniors over 65 years
COMPARE
French
Immigrants from Israel
Unemployment Among Seniors over 65 years
Unemployment Among Seniors over 65 years Comparison
French
Immigrants from Israel
5.1%
UNEMPLOYMENT AMONG SENIORS OVER 65 YEARS
68.1/ 100
METRIC RATING
160th/ 347
METRIC RANK
5.3%
UNEMPLOYMENT AMONG SENIORS OVER 65 YEARS
2.0/ 100
METRIC RATING
238th/ 347
METRIC RANK
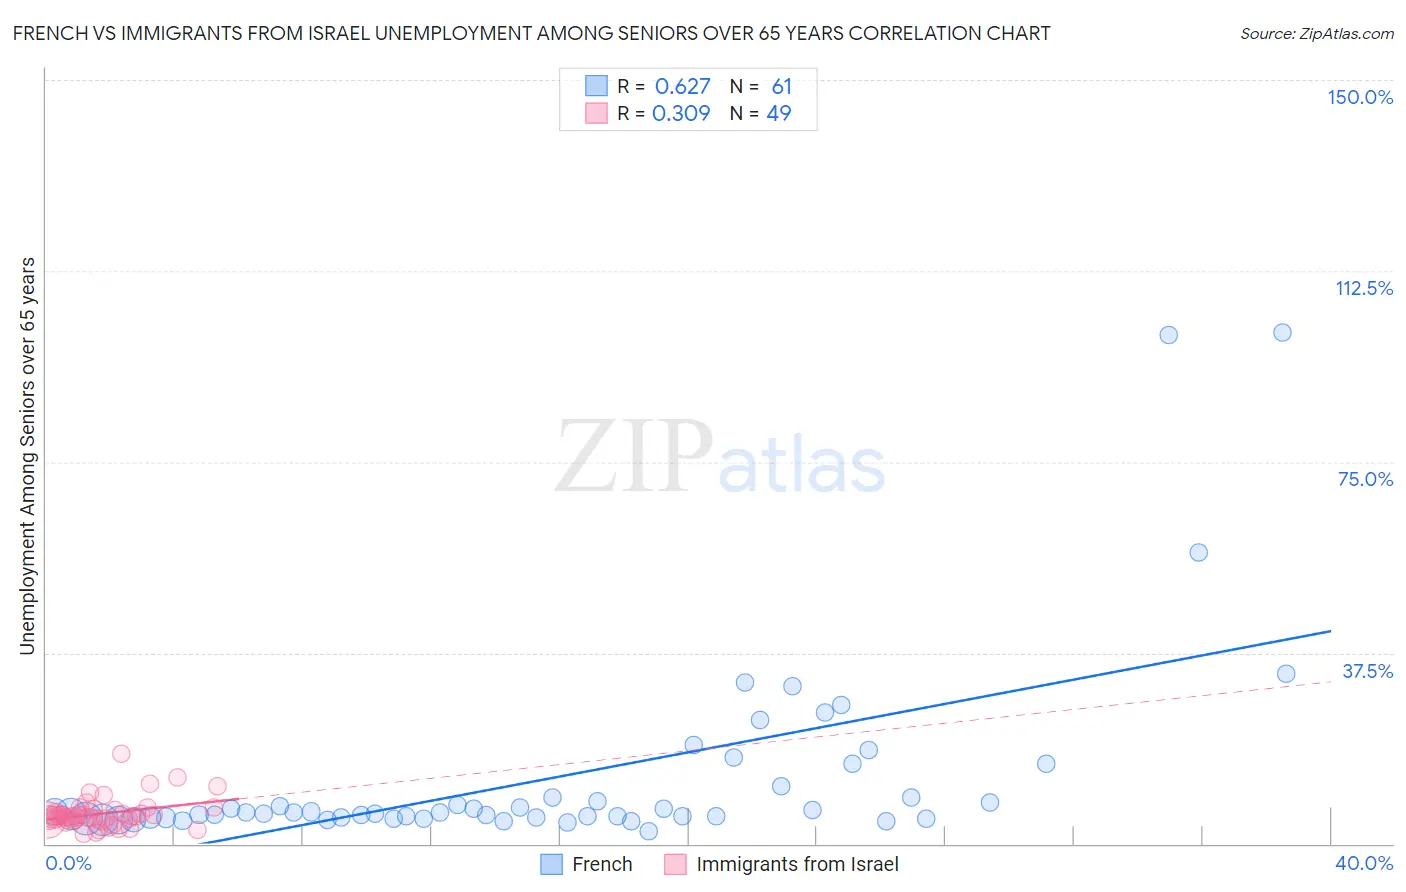
French vs Immigrants from Israel Unemployment Among Seniors over 65 years Correlation Chart
The statistical analysis conducted on geographies consisting of 461,949,032 people shows a significant positive correlation between the proportion of French and unemployment rate amomg seniors over the age of 65 in the United States with a correlation coefficient (R) of 0.627 and weighted average of 5.1%. Similarly, the statistical analysis conducted on geographies consisting of 201,020,149 people shows a mild positive correlation between the proportion of Immigrants from Israel and unemployment rate amomg seniors over the age of 65 in the United States with a correlation coefficient (R) of 0.309 and weighted average of 5.3%, a difference of 3.7%.
Unemployment Among Seniors over 65 years Correlation Summary
| Measurement | French | Immigrants from Israel |
| Minimum | 2.5% | 2.0% |
| Maximum | 100.3% | 17.8% |
| Range | 97.8% | 15.8% |
| Mean | 13.0% | 5.9% |
| Median | 6.1% | 5.3% |
| Interquartile 25% (IQ1) | 5.1% | 4.8% |
| Interquartile 75% (IQ3) | 10.1% | 6.3% |
| Interquartile Range (IQR) | 5.1% | 1.6% |
| Standard Deviation (Sample) | 18.8% | 2.9% |
| Standard Deviation (Population) | 18.7% | 2.8% |
Similar Demographics by Unemployment Among Seniors over 65 years
Demographics Similar to French by Unemployment Among Seniors over 65 years
In terms of unemployment among seniors over 65 years, the demographic groups most similar to French are Immigrants from France (5.1%, a difference of 0.020%), Immigrants from Belarus (5.1%, a difference of 0.030%), Immigrants from Northern Europe (5.1%, a difference of 0.070%), Immigrants from Bosnia and Herzegovina (5.1%, a difference of 0.070%), and Immigrants from South Eastern Asia (5.1%, a difference of 0.090%).
| Demographics | Rating | Rank | Unemployment Among Seniors over 65 years |
| Immigrants | Czechoslovakia | 74.5 /100 | #153 | Good 5.1% |
| Immigrants | Hong Kong | 74.0 /100 | #154 | Good 5.1% |
| Basques | 72.9 /100 | #155 | Good 5.1% |
| Immigrants | Romania | 72.4 /100 | #156 | Good 5.1% |
| Immigrants | Northern Europe | 69.8 /100 | #157 | Good 5.1% |
| Immigrants | Belarus | 69.0 /100 | #158 | Good 5.1% |
| Immigrants | France | 68.6 /100 | #159 | Good 5.1% |
| French | 68.1 /100 | #160 | Good 5.1% |
| Immigrants | Bosnia and Herzegovina | 66.1 /100 | #161 | Good 5.1% |
| Immigrants | South Eastern Asia | 65.6 /100 | #162 | Good 5.1% |
| Potawatomi | 64.5 /100 | #163 | Good 5.1% |
| Nepalese | 64.5 /100 | #164 | Good 5.1% |
| Immigrants | Ukraine | 64.2 /100 | #165 | Good 5.1% |
| Immigrants | Laos | 63.8 /100 | #166 | Good 5.1% |
| Immigrants | Western Europe | 60.4 /100 | #167 | Good 5.1% |
Demographics Similar to Immigrants from Israel by Unemployment Among Seniors over 65 years
In terms of unemployment among seniors over 65 years, the demographic groups most similar to Immigrants from Israel are Immigrants from Greece (5.3%, a difference of 0.010%), Immigrants from Senegal (5.3%, a difference of 0.060%), Immigrants from Costa Rica (5.3%, a difference of 0.070%), Immigrants from Trinidad and Tobago (5.3%, a difference of 0.17%), and Immigrants from Albania (5.3%, a difference of 0.26%).
| Demographics | Rating | Rank | Unemployment Among Seniors over 65 years |
| Hungarians | 3.9 /100 | #231 | Tragic 5.3% |
| Hopi | 3.5 /100 | #232 | Tragic 5.3% |
| Marshallese | 3.1 /100 | #233 | Tragic 5.3% |
| Blackfeet | 3.1 /100 | #234 | Tragic 5.3% |
| Immigrants | Albania | 2.7 /100 | #235 | Tragic 5.3% |
| Immigrants | Costa Rica | 2.1 /100 | #236 | Tragic 5.3% |
| Immigrants | Greece | 2.0 /100 | #237 | Tragic 5.3% |
| Immigrants | Israel | 2.0 /100 | #238 | Tragic 5.3% |
| Immigrants | Senegal | 1.8 /100 | #239 | Tragic 5.3% |
| Immigrants | Trinidad and Tobago | 1.6 /100 | #240 | Tragic 5.3% |
| Apache | 1.3 /100 | #241 | Tragic 5.3% |
| Bahamians | 0.9 /100 | #242 | Tragic 5.3% |
| Nigerians | 0.9 /100 | #243 | Tragic 5.3% |
| Peruvians | 0.8 /100 | #244 | Tragic 5.3% |
| Ottawa | 0.8 /100 | #245 | Tragic 5.3% |