French vs African Unemployment Among Ages 30 to 34 years
COMPARE
French
African
Unemployment Among Ages 30 to 34 years
Unemployment Among Ages 30 to 34 years Comparison
French
Africans
5.7%
UNEMPLOYMENT AMONG AGES 30 TO 34 YEARS
10.8/ 100
METRIC RATING
209th/ 347
METRIC RANK
6.4%
UNEMPLOYMENT AMONG AGES 30 TO 34 YEARS
0.0/ 100
METRIC RATING
282nd/ 347
METRIC RANK
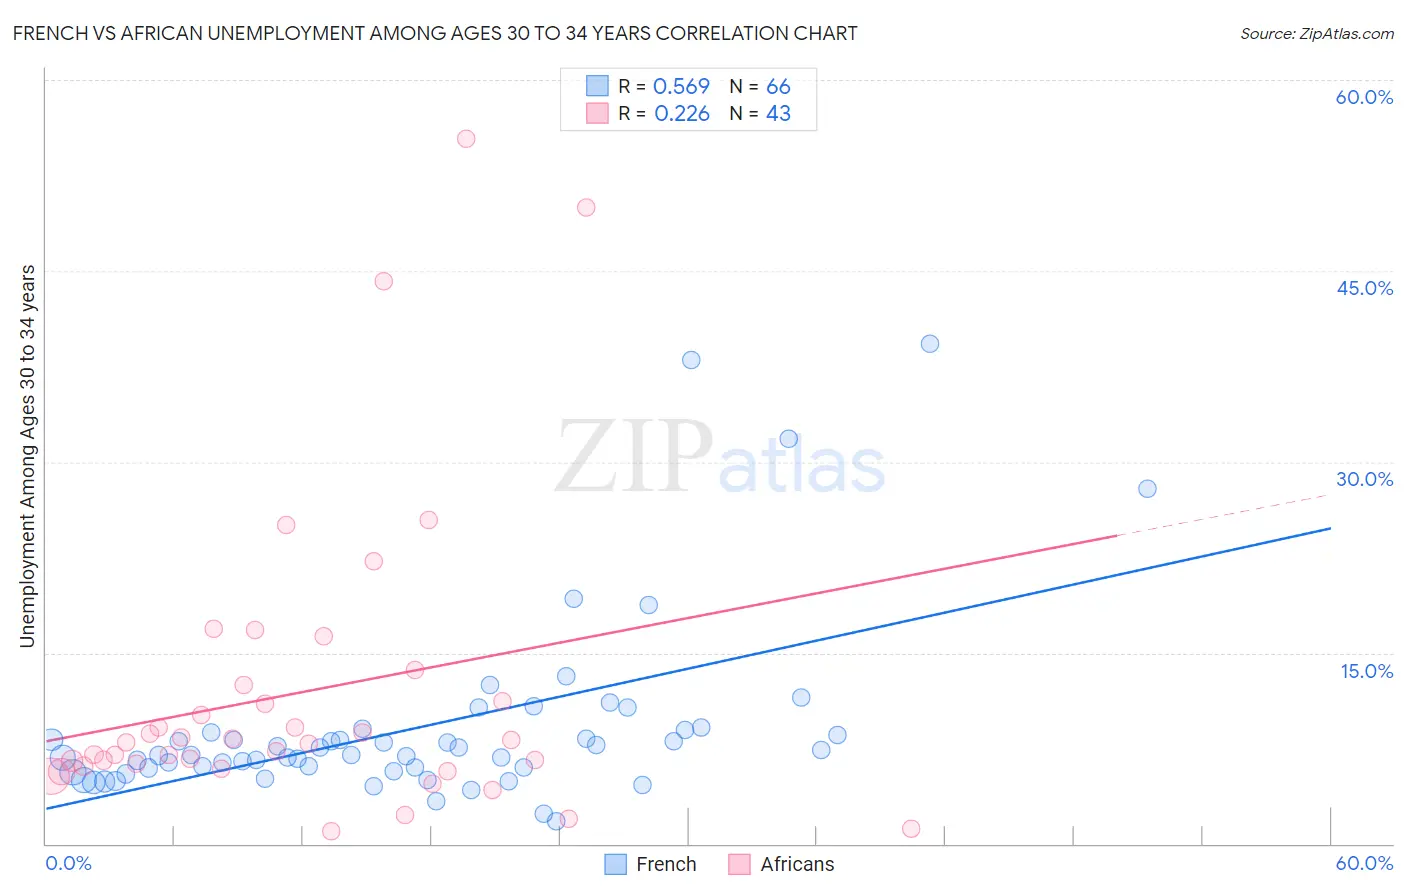
French vs African Unemployment Among Ages 30 to 34 years Correlation Chart
The statistical analysis conducted on geographies consisting of 499,116,726 people shows a substantial positive correlation between the proportion of French and unemployment rate among population between the ages 30 and 34 in the United States with a correlation coefficient (R) of 0.569 and weighted average of 5.7%. Similarly, the statistical analysis conducted on geographies consisting of 439,187,267 people shows a weak positive correlation between the proportion of Africans and unemployment rate among population between the ages 30 and 34 in the United States with a correlation coefficient (R) of 0.226 and weighted average of 6.4%, a difference of 13.3%.
Unemployment Among Ages 30 to 34 years Correlation Summary
| Measurement | French | African |
| Minimum | 1.8% | 1.0% |
| Maximum | 39.3% | 55.4% |
| Range | 37.5% | 54.4% |
| Mean | 9.1% | 11.9% |
| Median | 7.0% | 7.9% |
| Interquartile 25% (IQ1) | 6.0% | 6.1% |
| Interquartile 75% (IQ3) | 8.8% | 12.4% |
| Interquartile Range (IQR) | 2.8% | 6.3% |
| Standard Deviation (Sample) | 7.2% | 11.9% |
| Standard Deviation (Population) | 7.1% | 11.8% |
Similar Demographics by Unemployment Among Ages 30 to 34 years
Demographics Similar to French by Unemployment Among Ages 30 to 34 years
In terms of unemployment among ages 30 to 34 years, the demographic groups most similar to French are Immigrants from Philippines (5.7%, a difference of 0.12%), White/Caucasian (5.7%, a difference of 0.31%), Israeli (5.6%, a difference of 0.33%), Spanish American Indian (5.7%, a difference of 0.41%), and Scotch-Irish (5.7%, a difference of 0.42%).
| Demographics | Rating | Rank | Unemployment Among Ages 30 to 34 years |
| Immigrants | Germany | 22.9 /100 | #202 | Fair 5.6% |
| Koreans | 20.7 /100 | #203 | Fair 5.6% |
| Immigrants | Cameroon | 18.4 /100 | #204 | Poor 5.6% |
| Immigrants | Costa Rica | 14.4 /100 | #205 | Poor 5.6% |
| Alsatians | 14.3 /100 | #206 | Poor 5.6% |
| Israelis | 12.8 /100 | #207 | Poor 5.6% |
| Immigrants | Philippines | 11.5 /100 | #208 | Poor 5.7% |
| French | 10.8 /100 | #209 | Poor 5.7% |
| Whites/Caucasians | 9.2 /100 | #210 | Tragic 5.7% |
| Spanish American Indians | 8.7 /100 | #211 | Tragic 5.7% |
| Scotch-Irish | 8.6 /100 | #212 | Tragic 5.7% |
| Immigrants | Immigrants | 7.1 /100 | #213 | Tragic 5.7% |
| Immigrants | Panama | 5.9 /100 | #214 | Tragic 5.7% |
| Immigrants | Cambodia | 5.8 /100 | #215 | Tragic 5.7% |
| Immigrants | Syria | 5.5 /100 | #216 | Tragic 5.7% |
Demographics Similar to Africans by Unemployment Among Ages 30 to 34 years
In terms of unemployment among ages 30 to 34 years, the demographic groups most similar to Africans are Hispanic or Latino (6.4%, a difference of 0.030%), Immigrants from Bangladesh (6.4%, a difference of 0.090%), Choctaw (6.4%, a difference of 0.20%), Central American Indian (6.4%, a difference of 0.24%), and Immigrants from West Indies (6.4%, a difference of 0.26%).
| Demographics | Rating | Rank | Unemployment Among Ages 30 to 34 years |
| Ecuadorians | 0.0 /100 | #275 | Tragic 6.3% |
| Pennsylvania Germans | 0.0 /100 | #276 | Tragic 6.3% |
| Immigrants | Ecuador | 0.0 /100 | #277 | Tragic 6.3% |
| Osage | 0.0 /100 | #278 | Tragic 6.3% |
| Cree | 0.0 /100 | #279 | Tragic 6.4% |
| Cherokee | 0.0 /100 | #280 | Tragic 6.4% |
| Immigrants | Caribbean | 0.0 /100 | #281 | Tragic 6.4% |
| Africans | 0.0 /100 | #282 | Tragic 6.4% |
| Hispanics or Latinos | 0.0 /100 | #283 | Tragic 6.4% |
| Immigrants | Bangladesh | 0.0 /100 | #284 | Tragic 6.4% |
| Choctaw | 0.0 /100 | #285 | Tragic 6.4% |
| Central American Indians | 0.0 /100 | #286 | Tragic 6.4% |
| Immigrants | West Indies | 0.0 /100 | #287 | Tragic 6.4% |
| Senegalese | 0.0 /100 | #288 | Tragic 6.4% |
| Menominee | 0.0 /100 | #289 | Tragic 6.4% |