European vs Paiute Unemployment Among Ages 25 to 29 years
COMPARE
European
Paiute
Unemployment Among Ages 25 to 29 years
Unemployment Among Ages 25 to 29 years Comparison
Europeans
Paiute
6.4%
UNEMPLOYMENT AMONG AGES 25 TO 29 YEARS
87.8/ 100
METRIC RATING
110th/ 347
METRIC RANK
7.4%
UNEMPLOYMENT AMONG AGES 25 TO 29 YEARS
0.1/ 100
METRIC RATING
266th/ 347
METRIC RANK
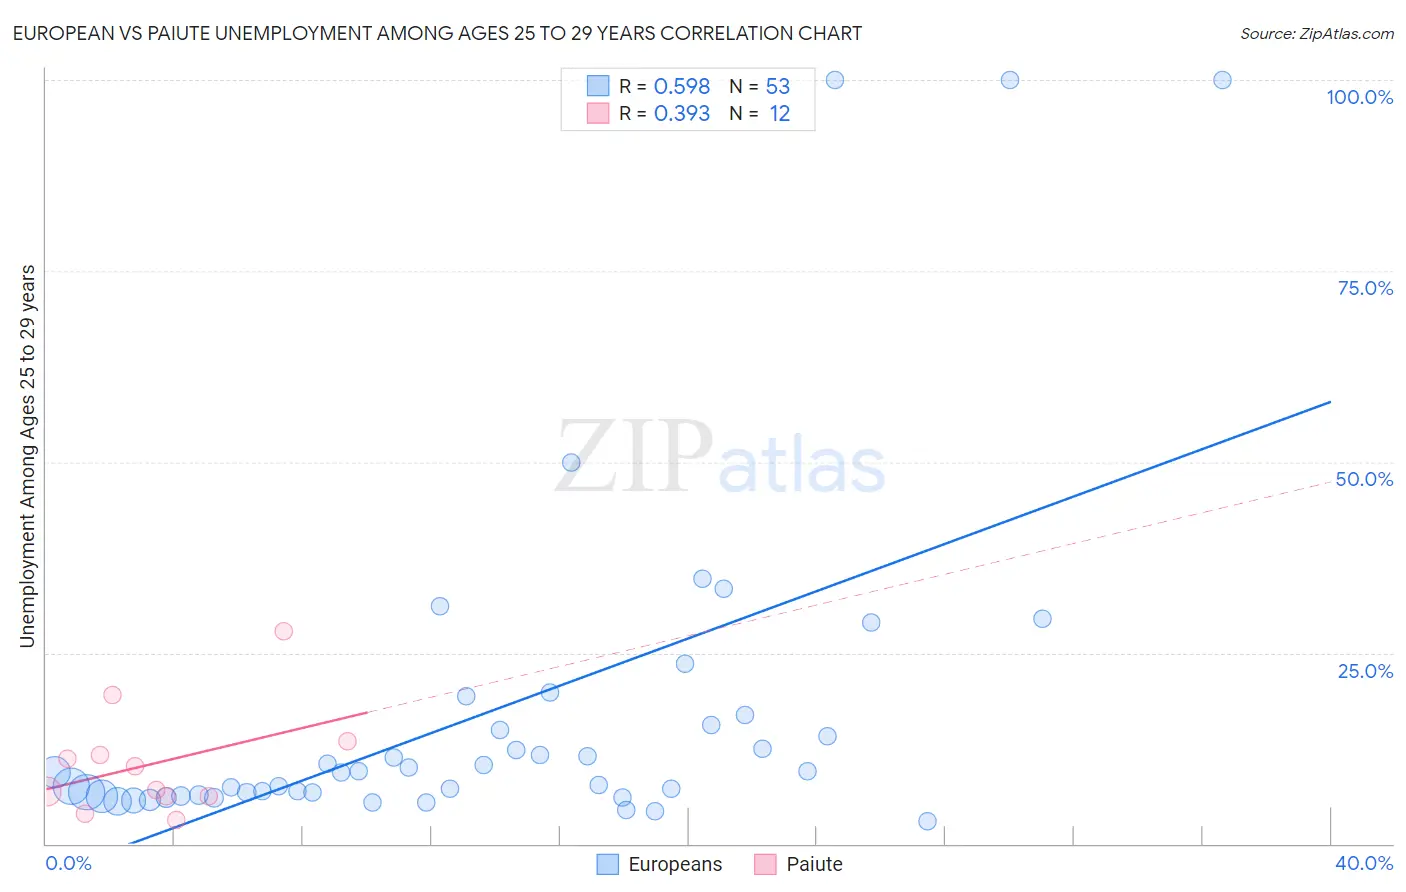
European vs Paiute Unemployment Among Ages 25 to 29 years Correlation Chart
The statistical analysis conducted on geographies consisting of 501,421,120 people shows a substantial positive correlation between the proportion of Europeans and unemployment rate among population between the ages 25 and 29 in the United States with a correlation coefficient (R) of 0.598 and weighted average of 6.4%. Similarly, the statistical analysis conducted on geographies consisting of 57,773,111 people shows a mild positive correlation between the proportion of Paiute and unemployment rate among population between the ages 25 and 29 in the United States with a correlation coefficient (R) of 0.393 and weighted average of 7.4%, a difference of 14.9%.
Unemployment Among Ages 25 to 29 years Correlation Summary
| Measurement | European | Paiute |
| Minimum | 3.0% | 3.1% |
| Maximum | 100.0% | 27.8% |
| Range | 97.0% | 24.7% |
| Mean | 17.3% | 10.6% |
| Median | 9.3% | 8.7% |
| Interquartile 25% (IQ1) | 6.3% | 6.2% |
| Interquartile 75% (IQ3) | 16.2% | 12.5% |
| Interquartile Range (IQR) | 9.9% | 6.3% |
| Standard Deviation (Sample) | 22.5% | 7.1% |
| Standard Deviation (Population) | 22.3% | 6.8% |
Similar Demographics by Unemployment Among Ages 25 to 29 years
Demographics Similar to Europeans by Unemployment Among Ages 25 to 29 years
In terms of unemployment among ages 25 to 29 years, the demographic groups most similar to Europeans are Immigrants from Albania (6.4%, a difference of 0.010%), Immigrants from Colombia (6.4%, a difference of 0.040%), Croatian (6.4%, a difference of 0.050%), Immigrants from Nicaragua (6.4%, a difference of 0.060%), and Swiss (6.4%, a difference of 0.11%).
| Demographics | Rating | Rank | Unemployment Among Ages 25 to 29 years |
| Immigrants | Congo | 90.4 /100 | #103 | Exceptional 6.4% |
| Cypriots | 90.1 /100 | #104 | Exceptional 6.4% |
| Immigrants | Kazakhstan | 89.8 /100 | #105 | Excellent 6.4% |
| Immigrants | Hungary | 89.4 /100 | #106 | Excellent 6.4% |
| Swiss | 88.6 /100 | #107 | Excellent 6.4% |
| Croatians | 88.2 /100 | #108 | Excellent 6.4% |
| Immigrants | Albania | 87.9 /100 | #109 | Excellent 6.4% |
| Europeans | 87.8 /100 | #110 | Excellent 6.4% |
| Immigrants | Colombia | 87.6 /100 | #111 | Excellent 6.4% |
| Immigrants | Nicaragua | 87.5 /100 | #112 | Excellent 6.4% |
| Immigrants | Egypt | 87.1 /100 | #113 | Excellent 6.5% |
| Germans | 86.3 /100 | #114 | Excellent 6.5% |
| Macedonians | 86.1 /100 | #115 | Excellent 6.5% |
| Pakistanis | 85.9 /100 | #116 | Excellent 6.5% |
| Immigrants | Uruguay | 85.7 /100 | #117 | Excellent 6.5% |
Demographics Similar to Paiute by Unemployment Among Ages 25 to 29 years
In terms of unemployment among ages 25 to 29 years, the demographic groups most similar to Paiute are Pennsylvania German (7.4%, a difference of 0.070%), Immigrants from Ecuador (7.4%, a difference of 0.090%), Immigrants from Fiji (7.4%, a difference of 0.14%), Immigrants from Latin America (7.4%, a difference of 0.15%), and Immigrants from Western Africa (7.4%, a difference of 0.21%).
| Demographics | Rating | Rank | Unemployment Among Ages 25 to 29 years |
| Cree | 0.1 /100 | #259 | Tragic 7.3% |
| Americans | 0.1 /100 | #260 | Tragic 7.4% |
| Nigerians | 0.1 /100 | #261 | Tragic 7.4% |
| Ecuadorians | 0.1 /100 | #262 | Tragic 7.4% |
| Kiowa | 0.1 /100 | #263 | Tragic 7.4% |
| Immigrants | Western Africa | 0.1 /100 | #264 | Tragic 7.4% |
| Immigrants | Fiji | 0.1 /100 | #265 | Tragic 7.4% |
| Paiute | 0.1 /100 | #266 | Tragic 7.4% |
| Pennsylvania Germans | 0.1 /100 | #267 | Tragic 7.4% |
| Immigrants | Ecuador | 0.1 /100 | #268 | Tragic 7.4% |
| Immigrants | Latin America | 0.1 /100 | #269 | Tragic 7.4% |
| Bahamians | 0.0 /100 | #270 | Tragic 7.5% |
| Choctaw | 0.0 /100 | #271 | Tragic 7.5% |
| Immigrants | Bahamas | 0.0 /100 | #272 | Tragic 7.5% |
| Immigrants | Nigeria | 0.0 /100 | #273 | Tragic 7.5% |