European vs Immigrants from Latin America Unemployment Among Ages 65 to 74 years

COMPARE

European
Race
Ancestry
AfghanAfricanAlaska NativeAlaskan AthabascanAlbanianAleutAlsatianAmericanApacheArabArapahoArgentineanArmenianAssyrian/Chaldean/SyriacAustralianAustrianBahamianBangladeshiBarbadianBasqueBelgianBelizeanBermudanBhutaneseBlackfeetBolivianBrazilianBritishBritish West IndianBulgarianBurmeseCajunCambodianCanadianCape VerdeanCarpatho RusynCelticCentral AmericanCentral American IndianCherokeeCheyenneChickasawChileanChineseChippewaChoctawColombianColvilleComancheCosta RicanCreeCreekCroatianCrowCubanCypriotCzechCzechoslovakianDanishDelawareDominicanDutchDutch West IndianEastern EuropeanEcuadorianEgyptianEnglishEstonianEthiopianEuropeanFijianFilipinoFinnishFrenchFrench American IndianFrench CanadianGermanGerman RussianGhanaianGreekGuamanian/ChamorroGuatemalanGuyaneseHaitianHmongHonduranHopiHoumaHungarianIcelanderIndian (Asian)IndonesianInupiatIranianIraqiIrishIroquoisIsraeliItalianJamaicanJapaneseJordanianKenyanKiowaKoreanLaotianLatvianLebaneseLiberianLithuanianLumbeeLuxembourgerMacedonianMalaysianMalteseMarshalleseMenomineeMexicanMexican American IndianMongolianMoroccanNative HawaiianNavajoNepaleseNew ZealanderNicaraguanNigerianNorthern EuropeanNorwegianOkinawanOsageOttawaPaiutePakistaniPalestinianPanamanianParaguayanPennsylvania GermanPeruvianPimaPolishPortuguesePotawatomiPuebloPuerto RicanPuget Sound SalishRomanianRussianSalvadoranSamoanScandinavianScotch-IrishScottishSeminoleSenegaleseSerbianShoshoneSierra LeoneanSiouxSlavicSlovakSloveneSomaliSouth AfricanSouth AmericanSouth American IndianSoviet UnionSpaniardSpanishSpanish AmericanSpanish American IndianSri LankanSubsaharan AfricanSudaneseSwedishSwissSyrianTaiwaneseThaiTlingit-HaidaTohono O'OdhamTonganTrinidadian and TobagonianTsimshianTurkishU.S. Virgin IslanderUgandanUkrainianUruguayanUteVenezuelanVietnameseWelshWest IndianYakamaYaquiYugoslavianYumanYup'ikZimbabwean
Immigration
NonimmigrantsImmigrantsAfghanistanAfricaAlbaniaArgentinaArmeniaAsiaAustraliaAustriaBahamasBangladeshBarbadosBelarusBelgiumBelizeBoliviaBosnia and HerzegovinaBrazilBulgariaBurma/MyanmarCabo VerdeCambodiaCameroonCanadaCaribbeanCentral AmericaChileChinaColombiaCongoCosta RicaCroatiaCubaCzechoslovakiaDenmarkDominicaDominican RepublicEastern AfricaEastern AsiaEastern EuropeEcuadorEgyptEl SalvadorEnglandEritreaEthiopiaEuropeFijiFranceGermanyGhanaGreeceGrenadaGuatemalaGuyanaHaitiHondurasHong KongHungaryIndiaIndonesiaIranIraqIrelandIsraelItalyJamaicaJapanJordanKazakhstanKenyaKoreaKuwaitLaosLatviaLebanonLiberiaLithuaniaMalaysiaMexicoMicronesiaMiddle AfricaMoldovaMoroccoNepalNetherlandsNicaraguaNigeriaNorth AmericaNorth MacedoniaNorthern AfricaNorthern EuropeNorwayOceaniaPakistanPanamaPeruPhilippinesPolandPortugalRomaniaRussiaSaudi ArabiaScotlandSenegalSerbiaSierra LeoneSingaporeSomaliaSouth AfricaSouth AmericaSouth Central AsiaSouth Eastern AsiaSouthern EuropeSpainSri LankaSt. Vincent and the GrenadinesSudanSwedenSwitzerlandSyriaTaiwanThailandTrinidad and TobagoTurkeyUgandaUkraineUruguayUzbekistanVenezuelaVietnamWest IndiesWestern AfricaWestern AsiaWestern EuropeYemenZaireZimbabweAzores
Immigrants from Latin America
Race
Ancestry
AfghanAfricanAlaska NativeAlaskan AthabascanAlbanianAleutAlsatianAmericanApacheArabArapahoArgentineanArmenianAssyrian/Chaldean/SyriacAustralianAustrianBahamianBangladeshiBarbadianBasqueBelgianBelizeanBermudanBhutaneseBlackfeetBolivianBrazilianBritishBritish West IndianBulgarianBurmeseCajunCambodianCanadianCape VerdeanCarpatho RusynCelticCentral AmericanCentral American IndianCherokeeCheyenneChickasawChileanChineseChippewaChoctawColombianColvilleComancheCosta RicanCreeCreekCroatianCrowCubanCypriotCzechCzechoslovakianDanishDelawareDominicanDutchDutch West IndianEastern EuropeanEcuadorianEgyptianEnglishEstonianEthiopianFijianFilipinoFinnishFrenchFrench American IndianFrench CanadianGermanGerman RussianGhanaianGreekGuamanian/ChamorroGuatemalanGuyaneseHaitianHmongHonduranHopiHoumaHungarianIcelanderIndian (Asian)IndonesianInupiatIranianIraqiIrishIroquoisIsraeliItalianJamaicanJapaneseJordanianKenyanKiowaKoreanLaotianLatvianLebaneseLiberianLithuanianLumbeeLuxembourgerMacedonianMalaysianMalteseMarshalleseMenomineeMexicanMexican American IndianMongolianMoroccanNative HawaiianNavajoNepaleseNew ZealanderNicaraguanNigerianNorthern EuropeanNorwegianOkinawanOsageOttawaPaiutePakistaniPalestinianPanamanianParaguayanPennsylvania GermanPeruvianPimaPolishPortuguesePotawatomiPuebloPuerto RicanPuget Sound SalishRomanianRussianSalvadoranSamoanScandinavianScotch-IrishScottishSeminoleSenegaleseSerbianShoshoneSierra LeoneanSiouxSlavicSlovakSloveneSomaliSouth AfricanSouth AmericanSouth American IndianSoviet UnionSpaniardSpanishSpanish AmericanSpanish American IndianSri LankanSubsaharan AfricanSudaneseSwedishSwissSyrianTaiwaneseThaiTlingit-HaidaTohono O'OdhamTonganTrinidadian and TobagonianTsimshianTurkishU.S. Virgin IslanderUgandanUkrainianUruguayanUteVenezuelanVietnameseWelshWest IndianYakamaYaquiYugoslavianYumanYup'ikZimbabwean
Immigration
NonimmigrantsImmigrantsAfghanistanAfricaAlbaniaArgentinaArmeniaAsiaAustraliaAustriaBahamasBangladeshBarbadosBelarusBelgiumBelizeBoliviaBosnia and HerzegovinaBrazilBulgariaBurma/MyanmarCabo VerdeCambodiaCameroonCanadaCaribbeanCentral AmericaChileChinaColombiaCongoCosta RicaCroatiaCubaCzechoslovakiaDenmarkDominicaDominican RepublicEastern AfricaEastern AsiaEastern EuropeEcuadorEgyptEl SalvadorEnglandEritreaEthiopiaEuropeFijiFranceGermanyGhanaGreeceGrenadaGuatemalaGuyanaHaitiHondurasHong KongHungaryIndiaIndonesiaIranIraqIrelandIsraelItalyJamaicaJapanJordanKazakhstanKenyaKoreaKuwaitLaosLatin AmericaLatviaLebanonLiberiaLithuaniaMalaysiaMexicoMicronesiaMiddle AfricaMoldovaMoroccoNepalNetherlandsNicaraguaNigeriaNorth AmericaNorth MacedoniaNorthern AfricaNorthern EuropeNorwayOceaniaPakistanPanamaPeruPhilippinesPolandPortugalRomaniaRussiaSaudi ArabiaScotlandSenegalSerbiaSierra LeoneSingaporeSomaliaSouth AfricaSouth AmericaSouth Central AsiaSouth Eastern AsiaSouthern EuropeSpainSri LankaSt. Vincent and the GrenadinesSudanSwedenSwitzerlandSyriaTaiwanThailandTrinidad and TobagoTurkeyUgandaUkraineUruguayUzbekistanVenezuelaVietnamWest IndiesWestern AfricaWestern AsiaWestern EuropeYemenZaireZimbabweAzores
Unemployment Among Ages 65 to 74 years
Income
Poverty
Unemployment
Labor Participation
Family Structure
Vehicle Availability
Education Level
Disability

Unemployment Among Ages 65 to 74 years Comparison

Europeans

Immigrants from Latin America

Exceptional
Tragic
5.1%
UNEMPLOYMENT AMONG AGES 65 TO 74 YEARS
99.6/ 100
METRIC RATING
52nd/ 347
METRIC RANK
5.8%
UNEMPLOYMENT AMONG AGES 65 TO 74 YEARS
0.0/ 100
METRIC RATING
298th/ 347
METRIC RANK

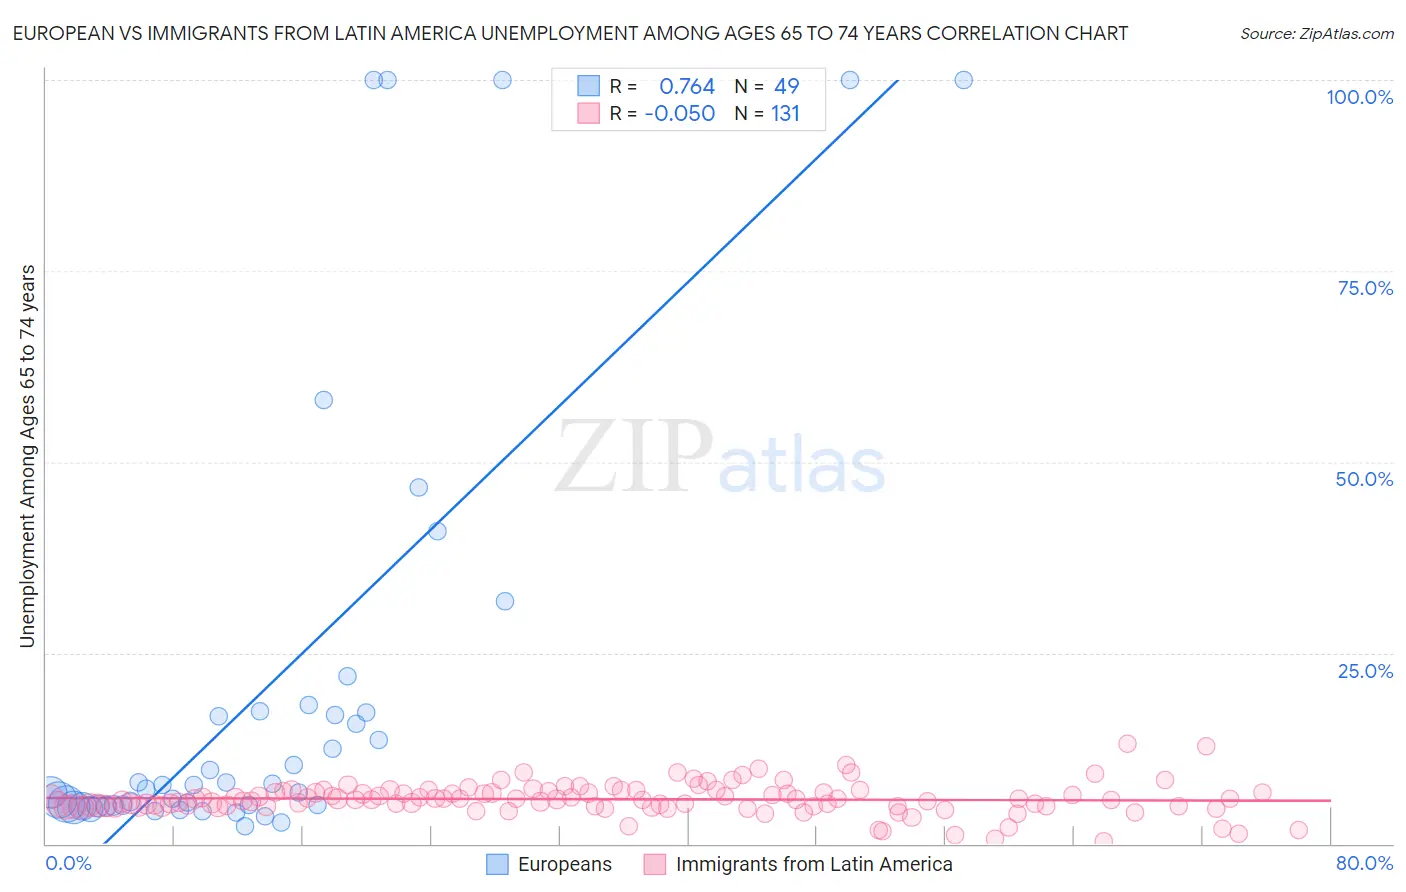
European vs Immigrants from Latin America Unemployment Among Ages 65 to 74 years Correlation Chart

The statistical analysis conducted on geographies consisting of 441,956,134 people shows a strong positive correlation between the proportion of Europeans and unemployment rate among population between the ages 65 and 74 in the United States with a correlation coefficient (R) of 0.764 and weighted average of 5.1%. Similarly, the statistical analysis conducted on geographies consisting of 443,604,034 people shows no correlation between the proportion of Immigrants from Latin America and unemployment rate among population between the ages 65 and 74 in the United States with a correlation coefficient (R) of -0.050 and weighted average of 5.8%, a difference of 13.7%.
European vs Immigrants from Latin America Unemployment Among Ages 65 to 74 years

Unemployment Among Ages 65 to 74 years Correlation Summary

MeasurementEuropeanImmigrants from Latin America
Minimum2.3%0.30%
Maximum100.0%13.1%
Range97.7%12.8%
Mean20.5%5.8%
Median7.7%5.8%
Interquartile 25% (IQ1)5.0%4.9%
Interquartile 75% (IQ3)17.2%6.8%
Interquartile Range (IQR)12.2%1.9%
Standard Deviation (Sample)29.3%2.0%
Standard Deviation (Population)29.0%2.0%

Similar Demographics by Unemployment Among Ages 65 to 74 years

Demographics Similar to Europeans by Unemployment Among Ages 65 to 74 years

In terms of unemployment among ages 65 to 74 years, the demographic groups most similar to Europeans are Immigrants from Ethiopia (5.1%, a difference of 0.010%), Immigrants from Nicaragua (5.1%, a difference of 0.030%), Carpatho Rusyn (5.1%, a difference of 0.12%), Swedish (5.1%, a difference of 0.20%), and Croatian (5.1%, a difference of 0.20%).
DemographicsRating | RankUnemployment Among Ages 65 to 74 years
Sioux
99.8
/100
|
#45
Exceptional
5.1%
Immigrants | Kenya
99.8
/100
|
#46
Exceptional
5.1%
Immigrants | Uganda
99.8
/100
|
#47
Exceptional
5.1%
Choctaw
99.8
/100
|
#48
Exceptional
5.1%
Immigrants | Austria
99.8
/100
|
#49
Exceptional
5.1%
Immigrants | Zimbabwe
99.7
/100
|
#50
Exceptional
5.1%
Immigrants | Kazakhstan
99.7
/100
|
#51
Exceptional
5.1%
Europeans
99.6
/100
|
#52
Exceptional
5.1%
Immigrants | Ethiopia
99.6
/100
|
#53
Exceptional
5.1%
Immigrants | Nicaragua
99.6
/100
|
#54
Exceptional
5.1%
Carpatho Rusyns
99.6
/100
|
#55
Exceptional
5.1%
Swedes
99.5
/100
|
#56
Exceptional
5.1%
Croatians
99.5
/100
|
#57
Exceptional
5.1%
Germans
99.5
/100
|
#58
Exceptional
5.1%
Immigrants | Bulgaria
99.4
/100
|
#59
Exceptional
5.1%

Demographics Similar to Immigrants from Latin America by Unemployment Among Ages 65 to 74 years

In terms of unemployment among ages 65 to 74 years, the demographic groups most similar to Immigrants from Latin America are Barbadian (5.8%, a difference of 0.010%), Ecuadorian (5.8%, a difference of 0.020%), Armenian (5.8%, a difference of 0.12%), Houma (5.8%, a difference of 0.19%), and Liberian (5.8%, a difference of 0.25%).
DemographicsRating | RankUnemployment Among Ages 65 to 74 years
Portuguese
0.0
/100
|
#291
Tragic
5.7%
U.S. Virgin Islanders
0.0
/100
|
#292
Tragic
5.8%
Immigrants | Grenada
0.0
/100
|
#293
Tragic
5.8%
Immigrants | Morocco
0.0
/100
|
#294
Tragic
5.8%
Blacks/African Americans
0.0
/100
|
#295
Tragic
5.8%
Pennsylvania Germans
0.0
/100
|
#296
Tragic
5.8%
Houma
0.0
/100
|
#297
Tragic
5.8%
Immigrants | Latin America
0.0
/100
|
#298
Tragic
5.8%
Barbadians
0.0
/100
|
#299
Tragic
5.8%
Ecuadorians
0.0
/100
|
#300
Tragic
5.8%
Armenians
0.0
/100
|
#301
Tragic
5.8%
Liberians
0.0
/100
|
#302
Tragic
5.8%
Arapaho
0.0
/100
|
#303
Tragic
5.8%
Salvadorans
0.0
/100
|
#304
Tragic
5.8%
Mexicans
0.0
/100
|
#305
Tragic
5.8%