Estonian vs Vietnamese Unemployment Among Ages 16 to 19 years
COMPARE
Estonian
Vietnamese
Unemployment Among Ages 16 to 19 years
Unemployment Among Ages 16 to 19 years Comparison
Estonians
Vietnamese
17.0%
UNEMPLOYMENT AMONG AGES 16 TO 19 YEARS
94.3/ 100
METRIC RATING
106th/ 347
METRIC RANK
21.5%
UNEMPLOYMENT AMONG AGES 16 TO 19 YEARS
0.0/ 100
METRIC RATING
310th/ 347
METRIC RANK
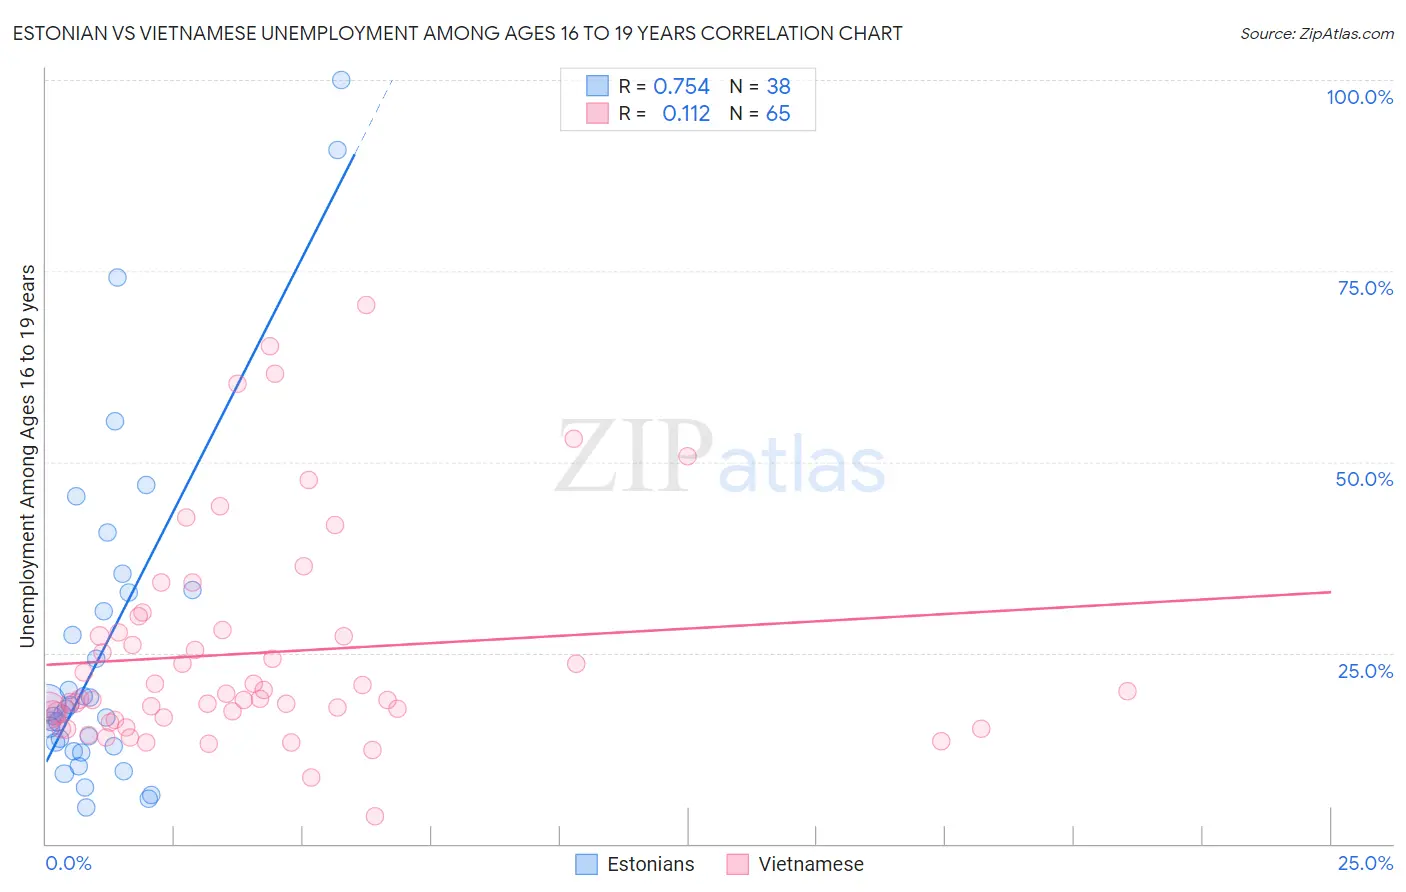
Estonian vs Vietnamese Unemployment Among Ages 16 to 19 years Correlation Chart
The statistical analysis conducted on geographies consisting of 120,320,445 people shows a strong positive correlation between the proportion of Estonians and unemployment rate among population between the ages 16 and 19 in the United States with a correlation coefficient (R) of 0.754 and weighted average of 17.0%. Similarly, the statistical analysis conducted on geographies consisting of 167,034,023 people shows a poor positive correlation between the proportion of Vietnamese and unemployment rate among population between the ages 16 and 19 in the United States with a correlation coefficient (R) of 0.112 and weighted average of 21.5%, a difference of 26.7%.
Unemployment Among Ages 16 to 19 years Correlation Summary
| Measurement | Estonian | Vietnamese |
| Minimum | 4.7% | 3.6% |
| Maximum | 100.0% | 70.6% |
| Range | 95.3% | 67.0% |
| Mean | 25.7% | 25.0% |
| Median | 17.4% | 19.0% |
| Interquartile 25% (IQ1) | 12.7% | 16.4% |
| Interquartile 75% (IQ3) | 32.9% | 27.9% |
| Interquartile Range (IQR) | 20.2% | 11.5% |
| Standard Deviation (Sample) | 22.3% | 14.2% |
| Standard Deviation (Population) | 22.0% | 14.1% |
Similar Demographics by Unemployment Among Ages 16 to 19 years
Demographics Similar to Estonians by Unemployment Among Ages 16 to 19 years
In terms of unemployment among ages 16 to 19 years, the demographic groups most similar to Estonians are Immigrants from Bulgaria (17.0%, a difference of 0.0%), Immigrants from Brazil (17.0%, a difference of 0.030%), Malaysian (17.0%, a difference of 0.030%), Palestinian (17.0%, a difference of 0.050%), and Italian (17.0%, a difference of 0.050%).
| Demographics | Rating | Rank | Unemployment Among Ages 16 to 19 years |
| Immigrants | Lithuania | 94.9 /100 | #99 | Exceptional 17.0% |
| Immigrants | Thailand | 94.7 /100 | #100 | Exceptional 17.0% |
| Immigrants | Saudi Arabia | 94.7 /100 | #101 | Exceptional 17.0% |
| Immigrants | Pakistan | 94.6 /100 | #102 | Exceptional 17.0% |
| Palestinians | 94.6 /100 | #103 | Exceptional 17.0% |
| Italians | 94.5 /100 | #104 | Exceptional 17.0% |
| Immigrants | Bulgaria | 94.3 /100 | #105 | Exceptional 17.0% |
| Estonians | 94.3 /100 | #106 | Exceptional 17.0% |
| Immigrants | Brazil | 94.2 /100 | #107 | Exceptional 17.0% |
| Malaysians | 94.2 /100 | #108 | Exceptional 17.0% |
| Iranians | 94.1 /100 | #109 | Exceptional 17.0% |
| Immigrants | Netherlands | 93.9 /100 | #110 | Exceptional 17.0% |
| Immigrants | Asia | 93.9 /100 | #111 | Exceptional 17.0% |
| Immigrants | Iraq | 93.7 /100 | #112 | Exceptional 17.0% |
| Icelanders | 93.4 /100 | #113 | Exceptional 17.0% |
Demographics Similar to Vietnamese by Unemployment Among Ages 16 to 19 years
In terms of unemployment among ages 16 to 19 years, the demographic groups most similar to Vietnamese are Native/Alaskan (21.5%, a difference of 0.060%), Immigrants from Bangladesh (21.5%, a difference of 0.22%), Belizean (21.6%, a difference of 0.22%), Houma (21.6%, a difference of 0.48%), and Black/African American (21.4%, a difference of 0.60%).
| Demographics | Rating | Rank | Unemployment Among Ages 16 to 19 years |
| Senegalese | 0.0 /100 | #303 | Tragic 21.0% |
| Aleuts | 0.0 /100 | #304 | Tragic 21.2% |
| Immigrants | Senegal | 0.0 /100 | #305 | Tragic 21.2% |
| U.S. Virgin Islanders | 0.0 /100 | #306 | Tragic 21.3% |
| Blacks/African Americans | 0.0 /100 | #307 | Tragic 21.4% |
| Immigrants | Bangladesh | 0.0 /100 | #308 | Tragic 21.5% |
| Natives/Alaskans | 0.0 /100 | #309 | Tragic 21.5% |
| Vietnamese | 0.0 /100 | #310 | Tragic 21.5% |
| Belizeans | 0.0 /100 | #311 | Tragic 21.6% |
| Houma | 0.0 /100 | #312 | Tragic 21.6% |
| Jamaicans | 0.0 /100 | #313 | Tragic 21.7% |
| Alaska Natives | 0.0 /100 | #314 | Tragic 21.8% |
| Immigrants | Dominica | 0.0 /100 | #315 | Tragic 21.9% |
| Tohono O'odham | 0.0 /100 | #316 | Tragic 22.1% |
| Immigrants | Belize | 0.0 /100 | #317 | Tragic 22.2% |