Estonian vs Immigrants from Taiwan Unemployment Among Ages 60 to 64 years
COMPARE
Estonian
Immigrants from Taiwan
Unemployment Among Ages 60 to 64 years
Unemployment Among Ages 60 to 64 years Comparison
Estonians
Immigrants from Taiwan
5.1%
UNEMPLOYMENT AMONG AGES 60 TO 64 YEARS
0.8/ 100
METRIC RATING
255th/ 347
METRIC RANK
4.8%
UNEMPLOYMENT AMONG AGES 60 TO 64 YEARS
66.0/ 100
METRIC RATING
158th/ 347
METRIC RANK
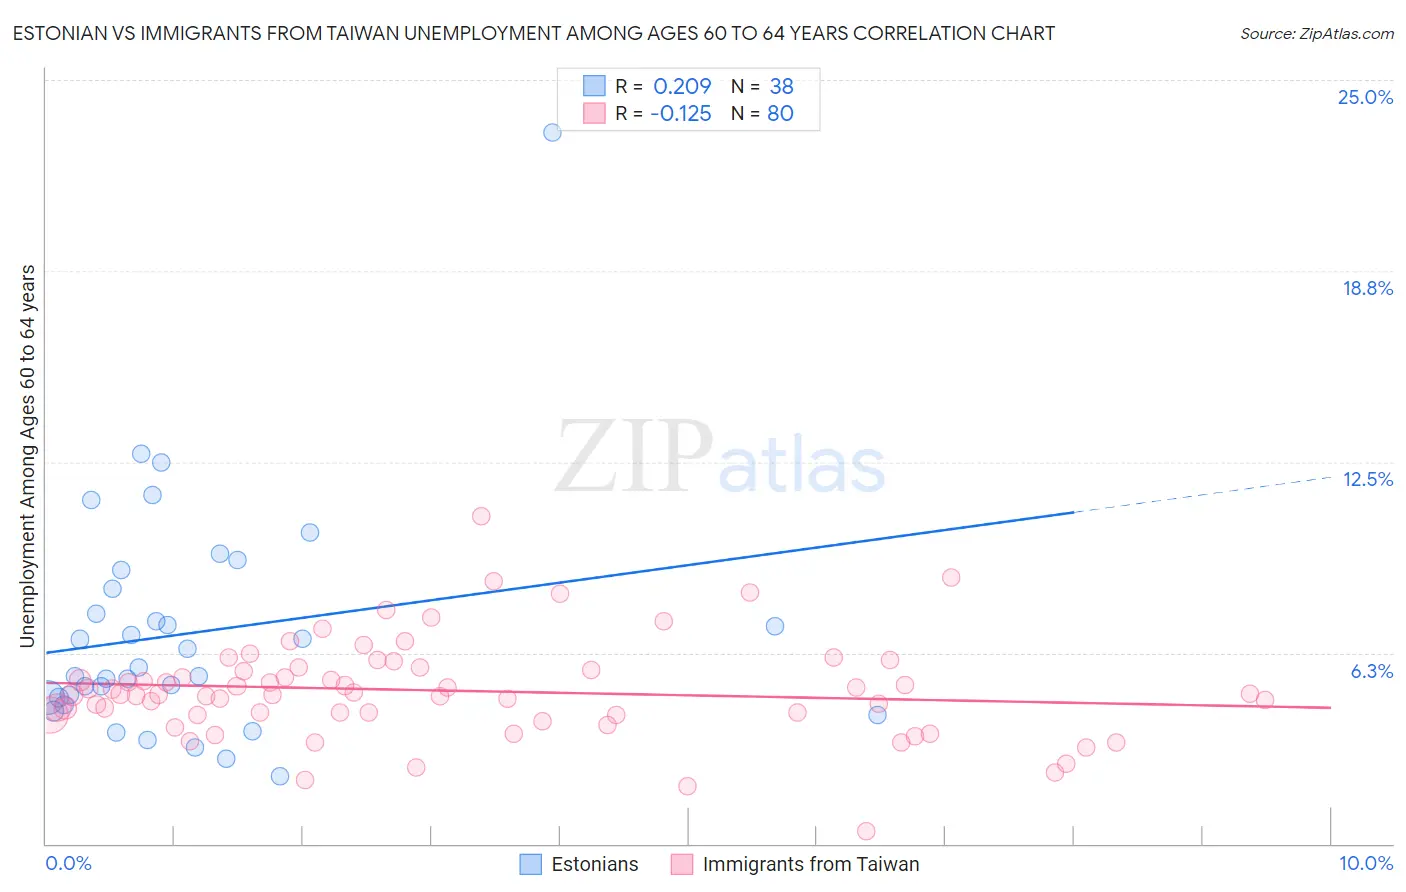
Estonian vs Immigrants from Taiwan Unemployment Among Ages 60 to 64 years Correlation Chart
The statistical analysis conducted on geographies consisting of 118,962,162 people shows a weak positive correlation between the proportion of Estonians and unemployment rate among population between the ages 60 and 64 in the United States with a correlation coefficient (R) of 0.209 and weighted average of 5.1%. Similarly, the statistical analysis conducted on geographies consisting of 278,919,372 people shows a poor negative correlation between the proportion of Immigrants from Taiwan and unemployment rate among population between the ages 60 and 64 in the United States with a correlation coefficient (R) of -0.125 and weighted average of 4.8%, a difference of 4.9%.
Unemployment Among Ages 60 to 64 years Correlation Summary
| Measurement | Estonian | Immigrants from Taiwan |
| Minimum | 2.2% | 0.40% |
| Maximum | 23.3% | 10.7% |
| Range | 21.1% | 10.3% |
| Mean | 6.9% | 5.0% |
| Median | 5.6% | 4.9% |
| Interquartile 25% (IQ1) | 4.8% | 4.2% |
| Interquartile 75% (IQ3) | 8.3% | 5.7% |
| Interquartile Range (IQR) | 3.6% | 1.5% |
| Standard Deviation (Sample) | 3.8% | 1.6% |
| Standard Deviation (Population) | 3.8% | 1.6% |
Similar Demographics by Unemployment Among Ages 60 to 64 years
Demographics Similar to Estonians by Unemployment Among Ages 60 to 64 years
In terms of unemployment among ages 60 to 64 years, the demographic groups most similar to Estonians are Costa Rican (5.1%, a difference of 0.010%), Immigrants from China (5.1%, a difference of 0.040%), Immigrants from Switzerland (5.1%, a difference of 0.080%), Immigrants from Uruguay (5.1%, a difference of 0.090%), and Immigrants from Peru (5.1%, a difference of 0.12%).
| Demographics | Rating | Rank | Unemployment Among Ages 60 to 64 years |
| Immigrants | Fiji | 1.1 /100 | #248 | Tragic 5.1% |
| South Americans | 1.0 /100 | #249 | Tragic 5.1% |
| Immigrants | Cambodia | 0.9 /100 | #250 | Tragic 5.1% |
| Immigrants | Uruguay | 0.9 /100 | #251 | Tragic 5.1% |
| Immigrants | Switzerland | 0.9 /100 | #252 | Tragic 5.1% |
| Immigrants | China | 0.9 /100 | #253 | Tragic 5.1% |
| Costa Ricans | 0.8 /100 | #254 | Tragic 5.1% |
| Estonians | 0.8 /100 | #255 | Tragic 5.1% |
| Immigrants | Peru | 0.7 /100 | #256 | Tragic 5.1% |
| Japanese | 0.6 /100 | #257 | Tragic 5.1% |
| Celtics | 0.5 /100 | #258 | Tragic 5.1% |
| Hondurans | 0.5 /100 | #259 | Tragic 5.1% |
| Immigrants | Honduras | 0.4 /100 | #260 | Tragic 5.1% |
| Immigrants | Ghana | 0.4 /100 | #261 | Tragic 5.1% |
| Immigrants | Uzbekistan | 0.4 /100 | #262 | Tragic 5.1% |
Demographics Similar to Immigrants from Taiwan by Unemployment Among Ages 60 to 64 years
In terms of unemployment among ages 60 to 64 years, the demographic groups most similar to Immigrants from Taiwan are Spanish (4.8%, a difference of 0.020%), Australian (4.8%, a difference of 0.030%), Immigrants from Norway (4.8%, a difference of 0.030%), South African (4.8%, a difference of 0.030%), and Laotian (4.8%, a difference of 0.040%).
| Demographics | Rating | Rank | Unemployment Among Ages 60 to 64 years |
| Immigrants | South Africa | 78.5 /100 | #151 | Good 4.8% |
| Americans | 75.7 /100 | #152 | Good 4.8% |
| Bolivians | 75.5 /100 | #153 | Good 4.8% |
| Chileans | 72.6 /100 | #154 | Good 4.8% |
| Filipinos | 72.1 /100 | #155 | Good 4.8% |
| Immigrants | Bolivia | 69.2 /100 | #156 | Good 4.8% |
| Laotians | 66.8 /100 | #157 | Good 4.8% |
| Immigrants | Taiwan | 66.0 /100 | #158 | Good 4.8% |
| Spanish | 65.5 /100 | #159 | Good 4.8% |
| Australians | 65.3 /100 | #160 | Good 4.8% |
| Immigrants | Norway | 65.1 /100 | #161 | Good 4.8% |
| South Africans | 65.1 /100 | #162 | Good 4.8% |
| Immigrants | Belgium | 64.8 /100 | #163 | Good 4.8% |
| Pakistanis | 64.6 /100 | #164 | Good 4.8% |
| Immigrants | Panama | 62.0 /100 | #165 | Good 4.8% |