English vs Okinawan Unemployment Among Ages 55 to 59 years
COMPARE
English
Okinawan
Unemployment Among Ages 55 to 59 years
Unemployment Among Ages 55 to 59 years Comparison
English
Okinawans
4.5%
UNEMPLOYMENT AMONG AGES 55 TO 59 YEARS
99.9/ 100
METRIC RATING
39th/ 347
METRIC RANK
4.5%
UNEMPLOYMENT AMONG AGES 55 TO 59 YEARS
99.6/ 100
METRIC RATING
58th/ 347
METRIC RANK
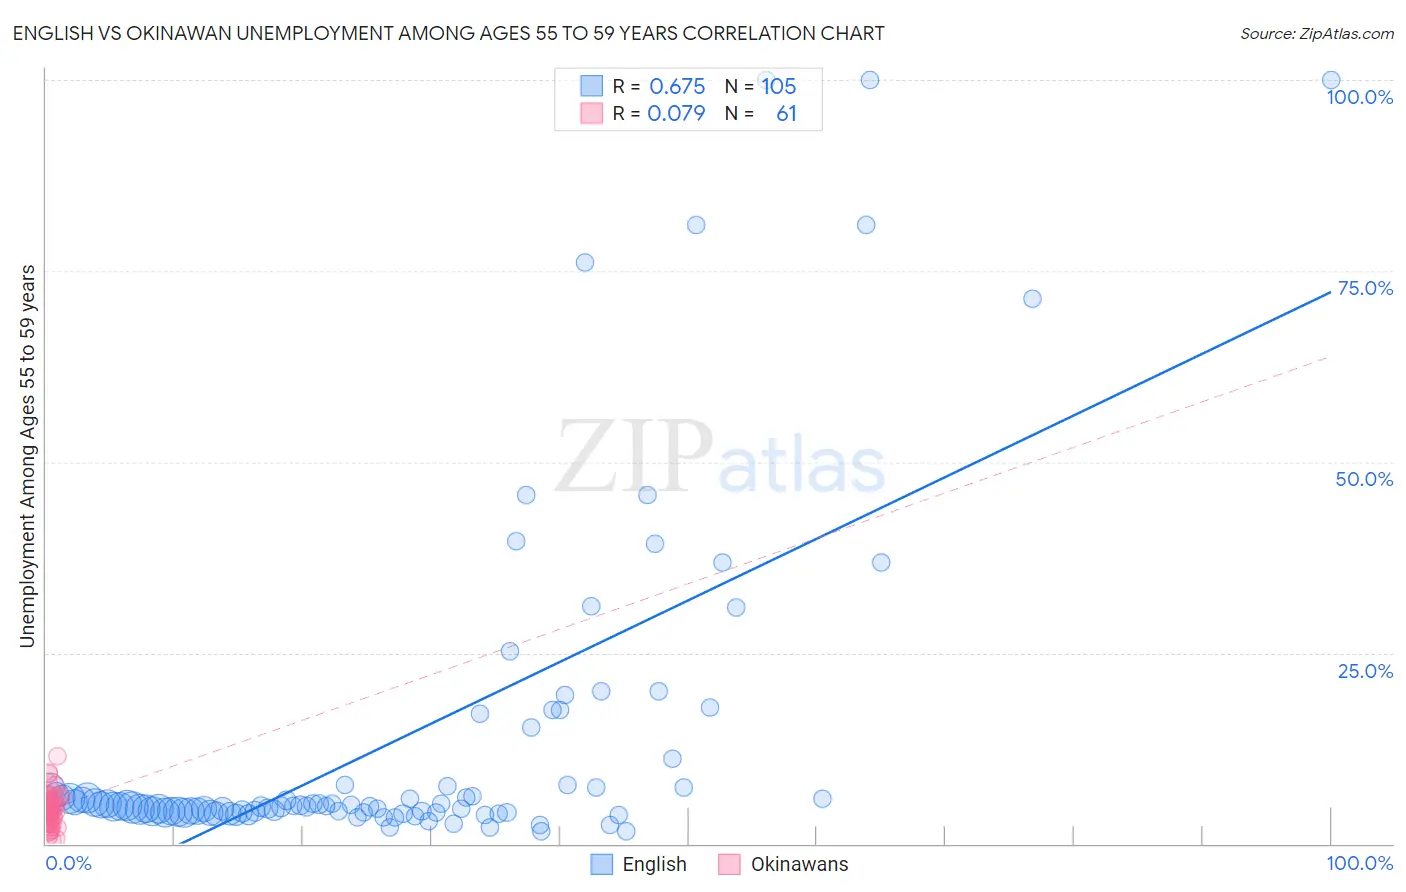
English vs Okinawan Unemployment Among Ages 55 to 59 years Correlation Chart
The statistical analysis conducted on geographies consisting of 488,949,268 people shows a significant positive correlation between the proportion of English and unemployment rate among population between the ages 55 and 59 in the United States with a correlation coefficient (R) of 0.675 and weighted average of 4.5%. Similarly, the statistical analysis conducted on geographies consisting of 72,675,649 people shows a slight positive correlation between the proportion of Okinawans and unemployment rate among population between the ages 55 and 59 in the United States with a correlation coefficient (R) of 0.079 and weighted average of 4.5%, a difference of 1.1%.
Unemployment Among Ages 55 to 59 years Correlation Summary
| Measurement | English | Okinawan |
| Minimum | 1.6% | 0.40% |
| Maximum | 100.0% | 11.4% |
| Range | 98.4% | 11.0% |
| Mean | 14.0% | 4.5% |
| Median | 5.0% | 4.4% |
| Interquartile 25% (IQ1) | 4.2% | 3.3% |
| Interquartile 75% (IQ3) | 7.7% | 5.4% |
| Interquartile Range (IQR) | 3.5% | 2.2% |
| Standard Deviation (Sample) | 22.1% | 2.0% |
| Standard Deviation (Population) | 22.0% | 2.0% |
Demographics Similar to English and Okinawans by Unemployment Among Ages 55 to 59 years
In terms of unemployment among ages 55 to 59 years, the demographic groups most similar to English are Assyrian/Chaldean/Syriac (4.5%, a difference of 0.26%), Swiss (4.5%, a difference of 0.26%), Luxembourger (4.5%, a difference of 0.27%), Immigrants from Kuwait (4.5%, a difference of 0.29%), and Immigrants from Korea (4.5%, a difference of 0.33%). Similarly, the demographic groups most similar to Okinawans are Northern European (4.5%, a difference of 0.020%), Welsh (4.5%, a difference of 0.030%), Immigrants from Nepal (4.5%, a difference of 0.080%), Burmese (4.5%, a difference of 0.17%), and Scottish (4.5%, a difference of 0.18%).
| Demographics | Rating | Rank | Unemployment Among Ages 55 to 59 years |
| Assyrians/Chaldeans/Syriacs | 99.9 /100 | #38 | Exceptional 4.5% |
| English | 99.9 /100 | #39 | Exceptional 4.5% |
| Swiss | 99.8 /100 | #40 | Exceptional 4.5% |
| Luxembourgers | 99.8 /100 | #41 | Exceptional 4.5% |
| Immigrants | Kuwait | 99.8 /100 | #42 | Exceptional 4.5% |
| Immigrants | Korea | 99.8 /100 | #43 | Exceptional 4.5% |
| Europeans | 99.8 /100 | #44 | Exceptional 4.5% |
| British | 99.8 /100 | #45 | Exceptional 4.5% |
| Immigrants | Zaire | 99.8 /100 | #46 | Exceptional 4.5% |
| German Russians | 99.8 /100 | #47 | Exceptional 4.5% |
| Immigrants | Moldova | 99.7 /100 | #48 | Exceptional 4.5% |
| Immigrants | Saudi Arabia | 99.7 /100 | #49 | Exceptional 4.5% |
| Immigrants | Pakistan | 99.7 /100 | #50 | Exceptional 4.5% |
| Maltese | 99.7 /100 | #51 | Exceptional 4.5% |
| Scottish | 99.7 /100 | #52 | Exceptional 4.5% |
| Immigrants | Middle Africa | 99.7 /100 | #53 | Exceptional 4.5% |
| Burmese | 99.7 /100 | #54 | Exceptional 4.5% |
| Immigrants | Nepal | 99.6 /100 | #55 | Exceptional 4.5% |
| Welsh | 99.6 /100 | #56 | Exceptional 4.5% |
| Northern Europeans | 99.6 /100 | #57 | Exceptional 4.5% |
| Okinawans | 99.6 /100 | #58 | Exceptional 4.5% |