English vs Immigrants from Uzbekistan Unemployment Among Women with Children Under 6 years
COMPARE
English
Immigrants from Uzbekistan
Unemployment Among Women with Children Under 6 years
Unemployment Among Women with Children Under 6 years Comparison
English
Immigrants from Uzbekistan
8.0%
UNEMPLOYMENT AMONG WOMEN WITH CHILDREN UNDER 6 YEARS
7.2/ 100
METRIC RATING
224th/ 347
METRIC RANK
6.3%
UNEMPLOYMENT AMONG WOMEN WITH CHILDREN UNDER 6 YEARS
100.0/ 100
METRIC RATING
16th/ 347
METRIC RANK
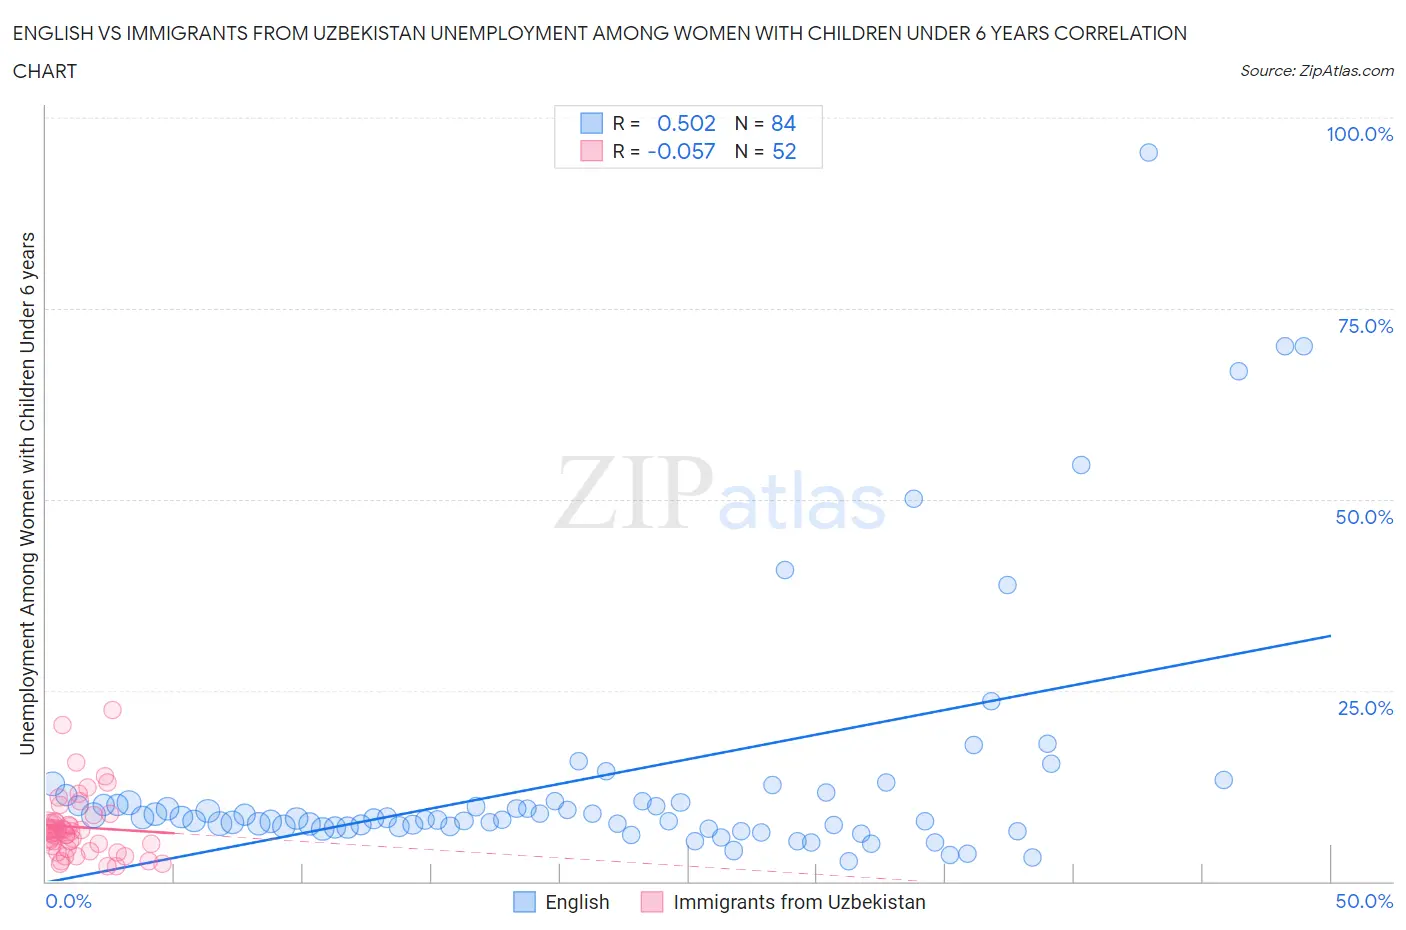
English vs Immigrants from Uzbekistan Unemployment Among Women with Children Under 6 years Correlation Chart
The statistical analysis conducted on geographies consisting of 378,453,397 people shows a substantial positive correlation between the proportion of English and unemployment rate among women with children under the age of 6 in the United States with a correlation coefficient (R) of 0.502 and weighted average of 8.0%. Similarly, the statistical analysis conducted on geographies consisting of 105,202,547 people shows a slight negative correlation between the proportion of Immigrants from Uzbekistan and unemployment rate among women with children under the age of 6 in the United States with a correlation coefficient (R) of -0.057 and weighted average of 6.3%, a difference of 25.5%.
Unemployment Among Women with Children Under 6 years Correlation Summary
| Measurement | English | Immigrants from Uzbekistan |
| Minimum | 2.6% | 2.0% |
| Maximum | 95.4% | 22.5% |
| Range | 92.8% | 20.5% |
| Mean | 13.7% | 7.1% |
| Median | 8.3% | 6.6% |
| Interquartile 25% (IQ1) | 7.2% | 4.5% |
| Interquartile 75% (IQ3) | 10.5% | 7.8% |
| Interquartile Range (IQR) | 3.3% | 3.3% |
| Standard Deviation (Sample) | 16.6% | 4.2% |
| Standard Deviation (Population) | 16.5% | 4.2% |
Similar Demographics by Unemployment Among Women with Children Under 6 years
Demographics Similar to English by Unemployment Among Women with Children Under 6 years
In terms of unemployment among women with children under 6 years, the demographic groups most similar to English are German (8.0%, a difference of 0.030%), Carpatho Rusyn (8.0%, a difference of 0.13%), Senegalese (8.0%, a difference of 0.25%), Portuguese (8.0%, a difference of 0.26%), and Samoan (7.9%, a difference of 0.27%).
| Demographics | Rating | Rank | Unemployment Among Women with Children Under 6 years |
| Immigrants | Nigeria | 10.3 /100 | #217 | Poor 7.9% |
| Moroccans | 9.7 /100 | #218 | Tragic 7.9% |
| Arabs | 9.4 /100 | #219 | Tragic 7.9% |
| South American Indians | 9.3 /100 | #220 | Tragic 7.9% |
| Immigrants | Germany | 8.5 /100 | #221 | Tragic 7.9% |
| Samoans | 8.4 /100 | #222 | Tragic 7.9% |
| Carpatho Rusyns | 7.8 /100 | #223 | Tragic 8.0% |
| English | 7.2 /100 | #224 | Tragic 8.0% |
| Germans | 7.0 /100 | #225 | Tragic 8.0% |
| Senegalese | 6.2 /100 | #226 | Tragic 8.0% |
| Portuguese | 6.2 /100 | #227 | Tragic 8.0% |
| Immigrants | Sudan | 6.0 /100 | #228 | Tragic 8.0% |
| Salvadorans | 5.5 /100 | #229 | Tragic 8.0% |
| Finns | 5.3 /100 | #230 | Tragic 8.0% |
| Trinidadians and Tobagonians | 5.3 /100 | #231 | Tragic 8.0% |
Demographics Similar to Immigrants from Uzbekistan by Unemployment Among Women with Children Under 6 years
In terms of unemployment among women with children under 6 years, the demographic groups most similar to Immigrants from Uzbekistan are Thai (6.3%, a difference of 0.30%), Immigrants from Bulgaria (6.3%, a difference of 0.40%), Immigrants from Malaysia (6.4%, a difference of 0.67%), Immigrants from Eastern Asia (6.3%, a difference of 0.72%), and Immigrants from Singapore (6.3%, a difference of 0.78%).
| Demographics | Rating | Rank | Unemployment Among Women with Children Under 6 years |
| Filipinos | 100.0 /100 | #9 | Exceptional 6.1% |
| Immigrants | China | 100.0 /100 | #10 | Exceptional 6.2% |
| Indians (Asian) | 100.0 /100 | #11 | Exceptional 6.3% |
| Immigrants | Singapore | 100.0 /100 | #12 | Exceptional 6.3% |
| Immigrants | Eastern Asia | 100.0 /100 | #13 | Exceptional 6.3% |
| Immigrants | Bulgaria | 100.0 /100 | #14 | Exceptional 6.3% |
| Thais | 100.0 /100 | #15 | Exceptional 6.3% |
| Immigrants | Uzbekistan | 100.0 /100 | #16 | Exceptional 6.3% |
| Immigrants | Malaysia | 100.0 /100 | #17 | Exceptional 6.4% |
| Assyrians/Chaldeans/Syriacs | 100.0 /100 | #18 | Exceptional 6.5% |
| Mongolians | 100.0 /100 | #19 | Exceptional 6.5% |
| Ute | 100.0 /100 | #20 | Exceptional 6.5% |
| Burmese | 100.0 /100 | #21 | Exceptional 6.5% |
| Immigrants | Korea | 100.0 /100 | #22 | Exceptional 6.5% |
| Bulgarians | 100.0 /100 | #23 | Exceptional 6.5% |