English vs Immigrants from Italy Unemployment Among Ages 65 to 74 years
COMPARE
English
Immigrants from Italy
Unemployment Among Ages 65 to 74 years
Unemployment Among Ages 65 to 74 years Comparison
English
Immigrants from Italy
5.2%
UNEMPLOYMENT AMONG AGES 65 TO 74 YEARS
97.8/ 100
METRIC RATING
89th/ 347
METRIC RANK
5.3%
UNEMPLOYMENT AMONG AGES 65 TO 74 YEARS
63.7/ 100
METRIC RATING
161st/ 347
METRIC RANK
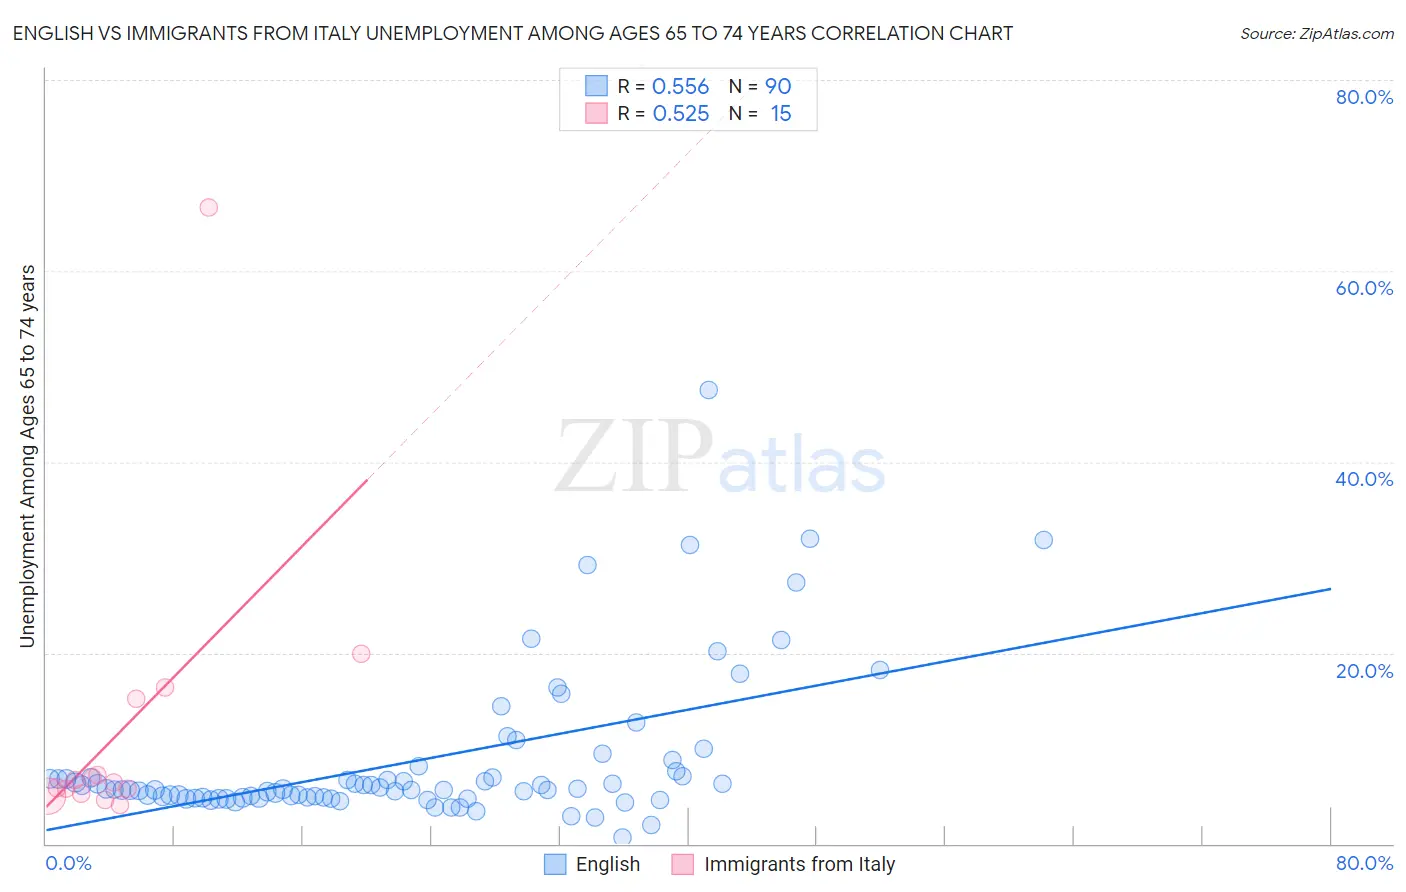
English vs Immigrants from Italy Unemployment Among Ages 65 to 74 years Correlation Chart
The statistical analysis conducted on geographies consisting of 447,132,305 people shows a substantial positive correlation between the proportion of English and unemployment rate among population between the ages 65 and 74 in the United States with a correlation coefficient (R) of 0.556 and weighted average of 5.2%. Similarly, the statistical analysis conducted on geographies consisting of 295,864,896 people shows a substantial positive correlation between the proportion of Immigrants from Italy and unemployment rate among population between the ages 65 and 74 in the United States with a correlation coefficient (R) of 0.525 and weighted average of 5.3%, a difference of 2.8%.
Unemployment Among Ages 65 to 74 years Correlation Summary
| Measurement | English | Immigrants from Italy |
| Minimum | 0.65% | 4.0% |
| Maximum | 47.5% | 66.7% |
| Range | 46.8% | 62.7% |
| Mean | 8.7% | 12.1% |
| Median | 5.7% | 6.5% |
| Interquartile 25% (IQ1) | 4.9% | 5.2% |
| Interquartile 75% (IQ3) | 7.1% | 15.2% |
| Interquartile Range (IQR) | 2.2% | 10.0% |
| Standard Deviation (Sample) | 7.9% | 15.9% |
| Standard Deviation (Population) | 7.9% | 15.3% |
Similar Demographics by Unemployment Among Ages 65 to 74 years
Demographics Similar to English by Unemployment Among Ages 65 to 74 years
In terms of unemployment among ages 65 to 74 years, the demographic groups most similar to English are Immigrants from Saudi Arabia (5.2%, a difference of 0.010%), Danish (5.2%, a difference of 0.020%), Scottish (5.2%, a difference of 0.020%), British (5.2%, a difference of 0.030%), and Immigrants from Hungary (5.2%, a difference of 0.070%).
| Demographics | Rating | Rank | Unemployment Among Ages 65 to 74 years |
| Thais | 98.6 /100 | #82 | Exceptional 5.2% |
| Immigrants | Middle Africa | 98.4 /100 | #83 | Exceptional 5.2% |
| Immigrants | Hungary | 98.0 /100 | #84 | Exceptional 5.2% |
| British | 97.9 /100 | #85 | Exceptional 5.2% |
| Danes | 97.9 /100 | #86 | Exceptional 5.2% |
| Scottish | 97.9 /100 | #87 | Exceptional 5.2% |
| Immigrants | Saudi Arabia | 97.9 /100 | #88 | Exceptional 5.2% |
| English | 97.8 /100 | #89 | Exceptional 5.2% |
| Luxembourgers | 97.6 /100 | #90 | Exceptional 5.2% |
| Romanians | 97.4 /100 | #91 | Exceptional 5.2% |
| Puget Sound Salish | 97.3 /100 | #92 | Exceptional 5.2% |
| Immigrants | Netherlands | 97.1 /100 | #93 | Exceptional 5.2% |
| South Africans | 97.1 /100 | #94 | Exceptional 5.2% |
| Serbians | 97.0 /100 | #95 | Exceptional 5.2% |
| Immigrants | Thailand | 97.0 /100 | #96 | Exceptional 5.2% |
Demographics Similar to Immigrants from Italy by Unemployment Among Ages 65 to 74 years
In terms of unemployment among ages 65 to 74 years, the demographic groups most similar to Immigrants from Italy are Immigrants from Eastern Asia (5.3%, a difference of 0.040%), Mongolian (5.3%, a difference of 0.050%), Bangladeshi (5.3%, a difference of 0.070%), Immigrants from Philippines (5.3%, a difference of 0.090%), and Immigrants from Czechoslovakia (5.3%, a difference of 0.10%).
| Demographics | Rating | Rank | Unemployment Among Ages 65 to 74 years |
| Poles | 72.4 /100 | #154 | Good 5.3% |
| Immigrants | Cameroon | 72.1 /100 | #155 | Good 5.3% |
| Dutch | 72.0 /100 | #156 | Good 5.3% |
| Immigrants | Eastern Europe | 71.5 /100 | #157 | Good 5.3% |
| Immigrants | France | 71.0 /100 | #158 | Good 5.3% |
| Immigrants | Czechoslovakia | 66.3 /100 | #159 | Good 5.3% |
| Bangladeshis | 65.8 /100 | #160 | Good 5.3% |
| Immigrants | Italy | 63.7 /100 | #161 | Good 5.3% |
| Immigrants | Eastern Asia | 62.5 /100 | #162 | Good 5.3% |
| Mongolians | 62.3 /100 | #163 | Good 5.3% |
| Immigrants | Philippines | 61.2 /100 | #164 | Good 5.3% |
| Immigrants | Bosnia and Herzegovina | 60.2 /100 | #165 | Good 5.3% |
| Slovaks | 60.0 /100 | #166 | Good 5.3% |
| Indians (Asian) | 59.9 /100 | #167 | Average 5.3% |
| Whites/Caucasians | 57.2 /100 | #168 | Average 5.4% |