English vs Arapaho Unemployment Among Women with Children Under 18 years
COMPARE
English
Arapaho
Unemployment Among Women with Children Under 18 years
Unemployment Among Women with Children Under 18 years Comparison
English
Arapaho
5.0%
UNEMPLOYMENT AMONG WOMEN WITH CHILDREN UNDER 18 YEARS
99.1/ 100
METRIC RATING
39th/ 347
METRIC RANK
9.2%
UNEMPLOYMENT AMONG WOMEN WITH CHILDREN UNDER 18 YEARS
0.0/ 100
METRIC RATING
343rd/ 347
METRIC RANK
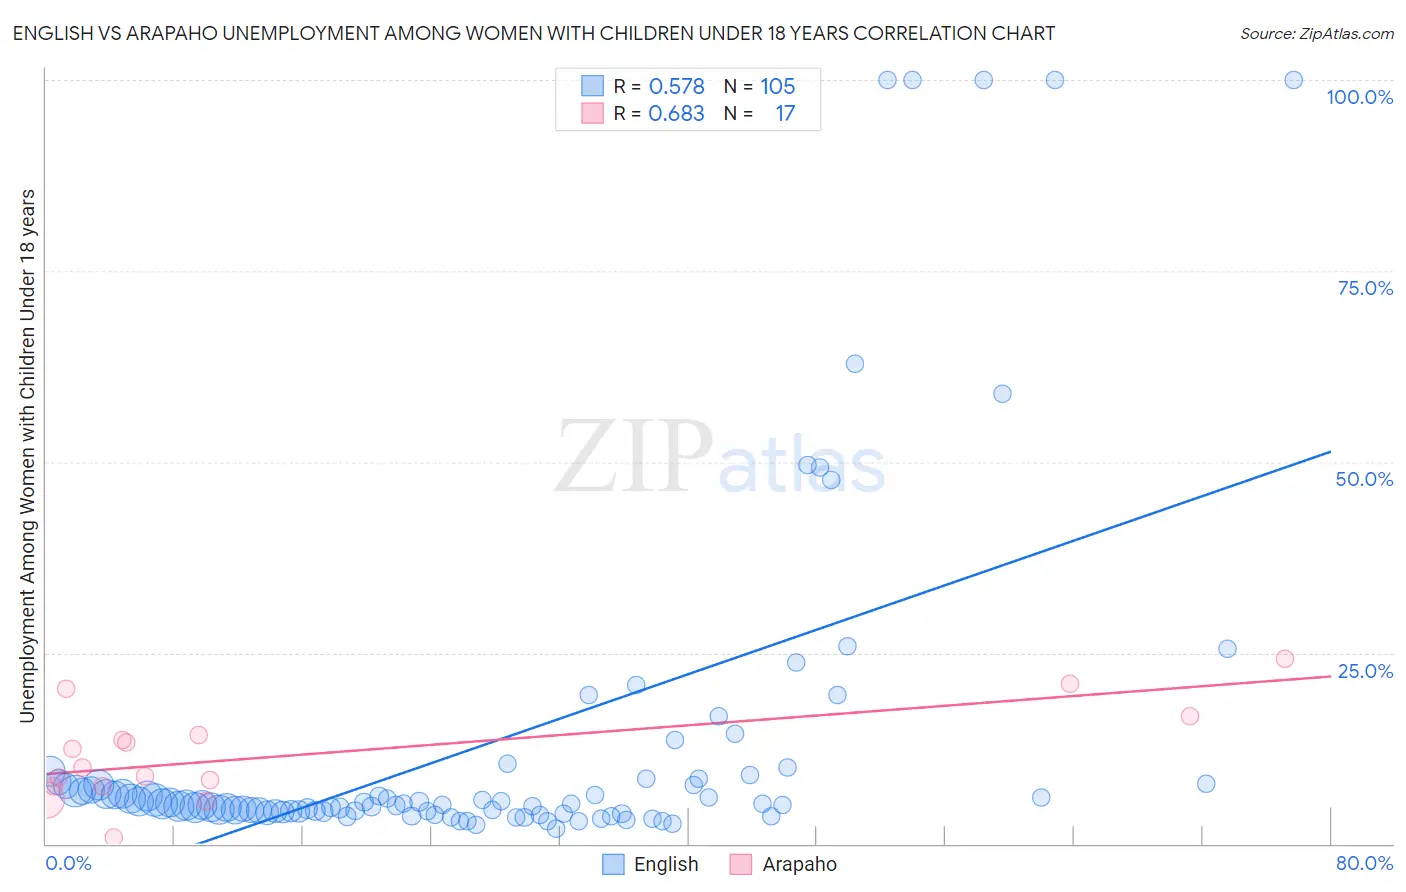
English vs Arapaho Unemployment Among Women with Children Under 18 years Correlation Chart
The statistical analysis conducted on geographies consisting of 519,569,042 people shows a substantial positive correlation between the proportion of English and unemployment rate among women with children under the age of 18 in the United States with a correlation coefficient (R) of 0.578 and weighted average of 5.0%. Similarly, the statistical analysis conducted on geographies consisting of 29,421,255 people shows a significant positive correlation between the proportion of Arapaho and unemployment rate among women with children under the age of 18 in the United States with a correlation coefficient (R) of 0.683 and weighted average of 9.2%, a difference of 84.3%.
Unemployment Among Women with Children Under 18 years Correlation Summary
| Measurement | English | Arapaho |
| Minimum | 2.0% | 0.80% |
| Maximum | 100.0% | 24.2% |
| Range | 98.0% | 23.4% |
| Mean | 13.2% | 11.7% |
| Median | 5.2% | 10.0% |
| Interquartile 25% (IQ1) | 4.2% | 7.5% |
| Interquartile 75% (IQ3) | 7.9% | 15.4% |
| Interquartile Range (IQR) | 3.7% | 7.9% |
| Standard Deviation (Sample) | 22.5% | 6.2% |
| Standard Deviation (Population) | 22.4% | 6.0% |
Similar Demographics by Unemployment Among Women with Children Under 18 years
Demographics Similar to English by Unemployment Among Women with Children Under 18 years
In terms of unemployment among women with children under 18 years, the demographic groups most similar to English are Bhutanese (5.0%, a difference of 0.10%), Polish (5.0%, a difference of 0.13%), Mongolian (5.0%, a difference of 0.15%), Luxembourger (5.0%, a difference of 0.22%), and Greek (5.0%, a difference of 0.25%).
| Demographics | Rating | Rank | Unemployment Among Women with Children Under 18 years |
| Dutch | 99.3 /100 | #32 | Exceptional 5.0% |
| Croatians | 99.3 /100 | #33 | Exceptional 5.0% |
| Immigrants | South Central Asia | 99.2 /100 | #34 | Exceptional 5.0% |
| Luxembourgers | 99.2 /100 | #35 | Exceptional 5.0% |
| Mongolians | 99.2 /100 | #36 | Exceptional 5.0% |
| Poles | 99.2 /100 | #37 | Exceptional 5.0% |
| Bhutanese | 99.2 /100 | #38 | Exceptional 5.0% |
| English | 99.1 /100 | #39 | Exceptional 5.0% |
| Greeks | 99.0 /100 | #40 | Exceptional 5.0% |
| Immigrants | Bosnia and Herzegovina | 99.0 /100 | #41 | Exceptional 5.0% |
| Eastern Europeans | 98.9 /100 | #42 | Exceptional 5.0% |
| Turks | 98.9 /100 | #43 | Exceptional 5.0% |
| Immigrants | Moldova | 98.9 /100 | #44 | Exceptional 5.0% |
| Immigrants | Malaysia | 98.8 /100 | #45 | Exceptional 5.0% |
| Immigrants | Korea | 98.7 /100 | #46 | Exceptional 5.0% |
Demographics Similar to Arapaho by Unemployment Among Women with Children Under 18 years
In terms of unemployment among women with children under 18 years, the demographic groups most similar to Arapaho are Puerto Rican (9.0%, a difference of 2.1%), Tohono O'odham (8.9%, a difference of 3.8%), Inupiat (9.6%, a difference of 4.2%), Yuman (9.8%, a difference of 6.2%), and Crow (8.2%, a difference of 11.6%).
| Demographics | Rating | Rank | Unemployment Among Women with Children Under 18 years |
| Immigrants | Dominican Republic | 0.0 /100 | #333 | Tragic 7.5% |
| Cheyenne | 0.0 /100 | #334 | Tragic 7.8% |
| Apache | 0.0 /100 | #335 | Tragic 7.9% |
| Sioux | 0.0 /100 | #336 | Tragic 7.9% |
| Yakama | 0.0 /100 | #337 | Tragic 8.1% |
| Immigrants | Yemen | 0.0 /100 | #338 | Tragic 8.2% |
| Navajo | 0.0 /100 | #339 | Tragic 8.2% |
| Crow | 0.0 /100 | #340 | Tragic 8.2% |
| Tohono O'odham | 0.0 /100 | #341 | Tragic 8.9% |
| Puerto Ricans | 0.0 /100 | #342 | Tragic 9.0% |
| Arapaho | 0.0 /100 | #343 | Tragic 9.2% |
| Inupiat | 0.0 /100 | #344 | Tragic 9.6% |
| Yuman | 0.0 /100 | #345 | Tragic 9.8% |
| Yup'ik | 0.0 /100 | #346 | Tragic 11.0% |
| Pima | 0.0 /100 | #347 | Tragic 11.7% |