Egyptian vs Moroccan Unemployment Among Women with Children Under 18 years
COMPARE
Egyptian
Moroccan
Unemployment Among Women with Children Under 18 years
Unemployment Among Women with Children Under 18 years Comparison
Egyptians
Moroccans
5.3%
UNEMPLOYMENT AMONG WOMEN WITH CHILDREN UNDER 18 YEARS
86.4/ 100
METRIC RATING
120th/ 347
METRIC RANK
5.9%
UNEMPLOYMENT AMONG WOMEN WITH CHILDREN UNDER 18 YEARS
1.4/ 100
METRIC RATING
242nd/ 347
METRIC RANK
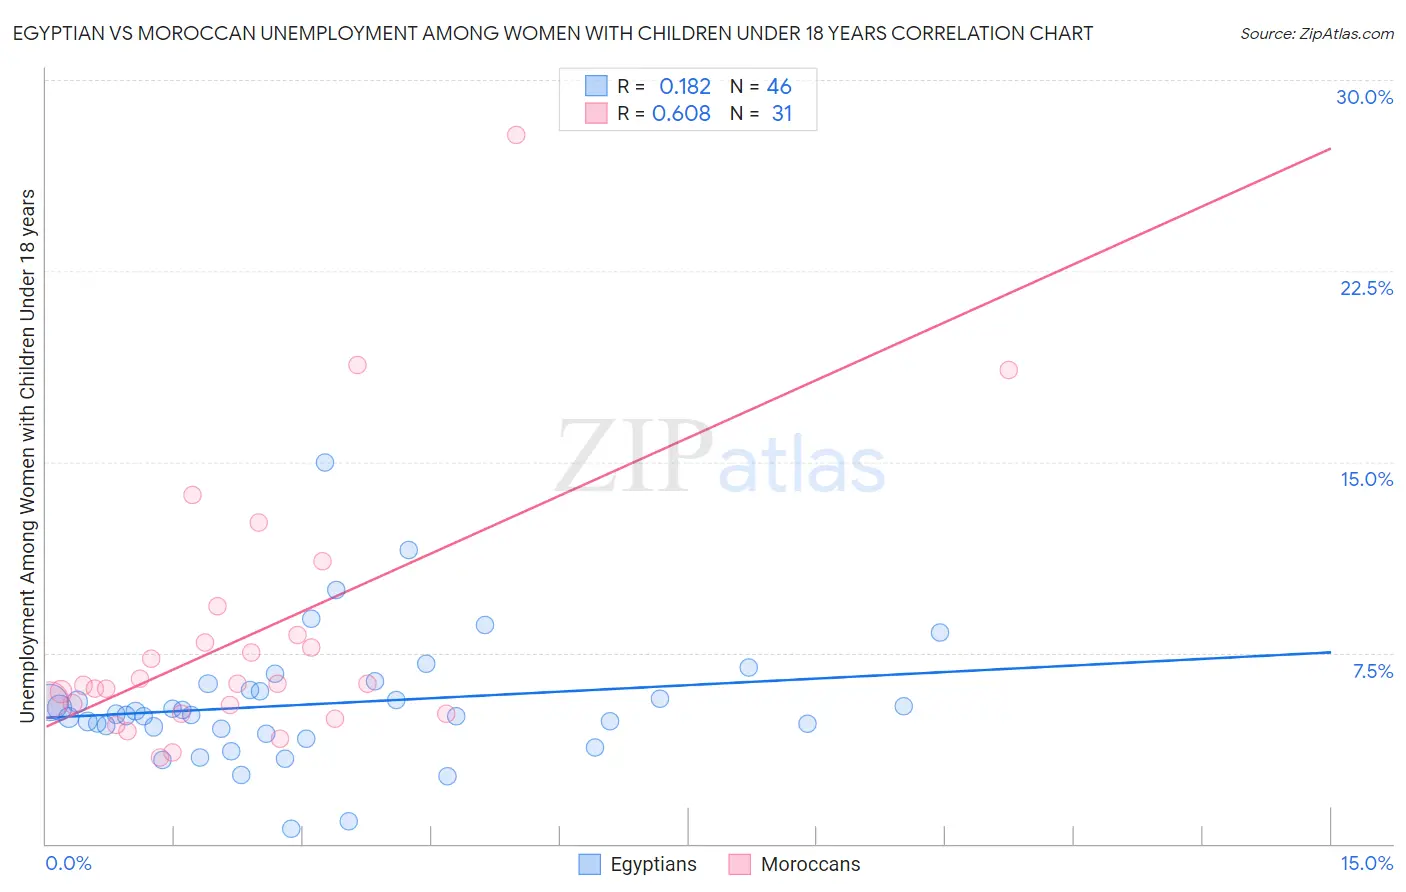
Egyptian vs Moroccan Unemployment Among Women with Children Under 18 years Correlation Chart
The statistical analysis conducted on geographies consisting of 270,511,535 people shows a poor positive correlation between the proportion of Egyptians and unemployment rate among women with children under the age of 18 in the United States with a correlation coefficient (R) of 0.182 and weighted average of 5.3%. Similarly, the statistical analysis conducted on geographies consisting of 198,704,682 people shows a significant positive correlation between the proportion of Moroccans and unemployment rate among women with children under the age of 18 in the United States with a correlation coefficient (R) of 0.608 and weighted average of 5.9%, a difference of 11.3%.
Unemployment Among Women with Children Under 18 years Correlation Summary
| Measurement | Egyptian | Moroccan |
| Minimum | 0.60% | 3.4% |
| Maximum | 15.0% | 27.8% |
| Range | 14.4% | 24.4% |
| Mean | 5.5% | 8.1% |
| Median | 5.1% | 6.3% |
| Interquartile 25% (IQ1) | 4.5% | 5.1% |
| Interquartile 75% (IQ3) | 6.0% | 8.2% |
| Interquartile Range (IQR) | 1.5% | 3.1% |
| Standard Deviation (Sample) | 2.5% | 5.3% |
| Standard Deviation (Population) | 2.4% | 5.2% |
Similar Demographics by Unemployment Among Women with Children Under 18 years
Demographics Similar to Egyptians by Unemployment Among Women with Children Under 18 years
In terms of unemployment among women with children under 18 years, the demographic groups most similar to Egyptians are Basque (5.3%, a difference of 0.020%), Immigrants from Europe (5.3%, a difference of 0.050%), Immigrants from Romania (5.3%, a difference of 0.090%), Scotch-Irish (5.3%, a difference of 0.11%), and Canadian (5.3%, a difference of 0.15%).
| Demographics | Rating | Rank | Unemployment Among Women with Children Under 18 years |
| French | 88.4 /100 | #113 | Excellent 5.2% |
| Kenyans | 88.2 /100 | #114 | Excellent 5.3% |
| Hungarians | 88.1 /100 | #115 | Excellent 5.3% |
| Macedonians | 87.7 /100 | #116 | Excellent 5.3% |
| Canadians | 87.4 /100 | #117 | Excellent 5.3% |
| Immigrants | Europe | 86.7 /100 | #118 | Excellent 5.3% |
| Basques | 86.5 /100 | #119 | Excellent 5.3% |
| Egyptians | 86.4 /100 | #120 | Excellent 5.3% |
| Immigrants | Romania | 85.8 /100 | #121 | Excellent 5.3% |
| Scotch-Irish | 85.7 /100 | #122 | Excellent 5.3% |
| Sudanese | 84.3 /100 | #123 | Excellent 5.3% |
| Native Hawaiians | 84.0 /100 | #124 | Excellent 5.3% |
| Immigrants | North Macedonia | 83.2 /100 | #125 | Excellent 5.3% |
| Immigrants | Oceania | 83.1 /100 | #126 | Excellent 5.3% |
| Whites/Caucasians | 82.9 /100 | #127 | Excellent 5.3% |
Demographics Similar to Moroccans by Unemployment Among Women with Children Under 18 years
In terms of unemployment among women with children under 18 years, the demographic groups most similar to Moroccans are Brazilian (5.8%, a difference of 0.22%), Immigrants from Uruguay (5.9%, a difference of 0.29%), Choctaw (5.9%, a difference of 0.33%), Ugandan (5.9%, a difference of 0.38%), and Uruguayan (5.9%, a difference of 0.51%).
| Demographics | Rating | Rank | Unemployment Among Women with Children Under 18 years |
| Immigrants | Middle Africa | 2.8 /100 | #235 | Tragic 5.8% |
| Alsatians | 2.5 /100 | #236 | Tragic 5.8% |
| Immigrants | Lebanon | 2.4 /100 | #237 | Tragic 5.8% |
| Immigrants | Somalia | 2.2 /100 | #238 | Tragic 5.8% |
| Immigrants | Sierra Leone | 2.0 /100 | #239 | Tragic 5.8% |
| Immigrants | Immigrants | 2.0 /100 | #240 | Tragic 5.8% |
| Brazilians | 1.6 /100 | #241 | Tragic 5.8% |
| Moroccans | 1.4 /100 | #242 | Tragic 5.9% |
| Immigrants | Uruguay | 1.1 /100 | #243 | Tragic 5.9% |
| Choctaw | 1.1 /100 | #244 | Tragic 5.9% |
| Ugandans | 1.1 /100 | #245 | Tragic 5.9% |
| Uruguayans | 1.0 /100 | #246 | Tragic 5.9% |
| Cape Verdeans | 1.0 /100 | #247 | Tragic 5.9% |
| Delaware | 0.8 /100 | #248 | Tragic 5.9% |
| Immigrants | Cameroon | 0.8 /100 | #249 | Tragic 5.9% |