Ecuadorian vs Belgian Unemployment Among Ages 65 to 74 years
COMPARE
Ecuadorian
Belgian
Unemployment Among Ages 65 to 74 years
Unemployment Among Ages 65 to 74 years Comparison
Ecuadorians
Belgians
5.8%
UNEMPLOYMENT AMONG AGES 65 TO 74 YEARS
0.0/ 100
METRIC RATING
300th/ 347
METRIC RANK
5.0%
UNEMPLOYMENT AMONG AGES 65 TO 74 YEARS
100.0/ 100
METRIC RATING
33rd/ 347
METRIC RANK
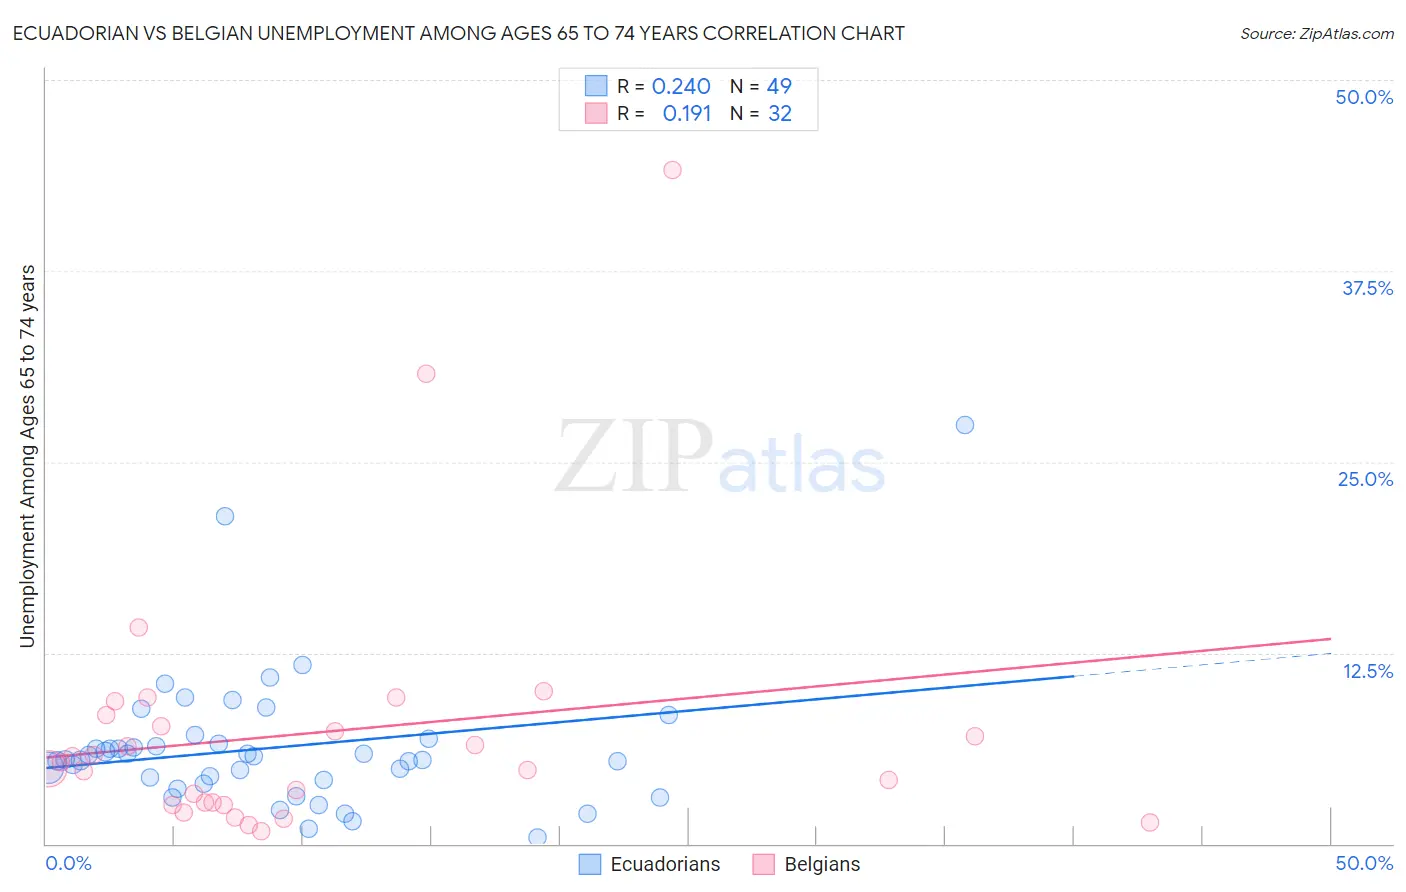
Ecuadorian vs Belgian Unemployment Among Ages 65 to 74 years Correlation Chart
The statistical analysis conducted on geographies consisting of 288,766,867 people shows a weak positive correlation between the proportion of Ecuadorians and unemployment rate among population between the ages 65 and 74 in the United States with a correlation coefficient (R) of 0.240 and weighted average of 5.8%. Similarly, the statistical analysis conducted on geographies consisting of 310,290,387 people shows a poor positive correlation between the proportion of Belgians and unemployment rate among population between the ages 65 and 74 in the United States with a correlation coefficient (R) of 0.191 and weighted average of 5.0%, a difference of 16.0%.
Unemployment Among Ages 65 to 74 years Correlation Summary
| Measurement | Ecuadorian | Belgian |
| Minimum | 0.40% | 0.80% |
| Maximum | 27.4% | 44.1% |
| Range | 27.0% | 43.3% |
| Mean | 6.3% | 7.3% |
| Median | 5.5% | 5.1% |
| Interquartile 25% (IQ1) | 4.0% | 2.6% |
| Interquartile 75% (IQ3) | 6.7% | 8.1% |
| Interquartile Range (IQR) | 2.7% | 5.4% |
| Standard Deviation (Sample) | 4.6% | 8.7% |
| Standard Deviation (Population) | 4.5% | 8.5% |
Similar Demographics by Unemployment Among Ages 65 to 74 years
Demographics Similar to Ecuadorians by Unemployment Among Ages 65 to 74 years
In terms of unemployment among ages 65 to 74 years, the demographic groups most similar to Ecuadorians are Barbadian (5.8%, a difference of 0.010%), Immigrants from Latin America (5.8%, a difference of 0.020%), Armenian (5.8%, a difference of 0.11%), Houma (5.8%, a difference of 0.20%), and Liberian (5.8%, a difference of 0.23%).
| Demographics | Rating | Rank | Unemployment Among Ages 65 to 74 years |
| Immigrants | Grenada | 0.0 /100 | #293 | Tragic 5.8% |
| Immigrants | Morocco | 0.0 /100 | #294 | Tragic 5.8% |
| Blacks/African Americans | 0.0 /100 | #295 | Tragic 5.8% |
| Pennsylvania Germans | 0.0 /100 | #296 | Tragic 5.8% |
| Houma | 0.0 /100 | #297 | Tragic 5.8% |
| Immigrants | Latin America | 0.0 /100 | #298 | Tragic 5.8% |
| Barbadians | 0.0 /100 | #299 | Tragic 5.8% |
| Ecuadorians | 0.0 /100 | #300 | Tragic 5.8% |
| Armenians | 0.0 /100 | #301 | Tragic 5.8% |
| Liberians | 0.0 /100 | #302 | Tragic 5.8% |
| Arapaho | 0.0 /100 | #303 | Tragic 5.8% |
| Salvadorans | 0.0 /100 | #304 | Tragic 5.8% |
| Mexicans | 0.0 /100 | #305 | Tragic 5.8% |
| Cheyenne | 0.0 /100 | #306 | Tragic 5.8% |
| British West Indians | 0.0 /100 | #307 | Tragic 5.8% |
Demographics Similar to Belgians by Unemployment Among Ages 65 to 74 years
In terms of unemployment among ages 65 to 74 years, the demographic groups most similar to Belgians are Cambodian (5.0%, a difference of 0.0%), Palestinian (5.0%, a difference of 0.050%), Bhutanese (5.0%, a difference of 0.11%), Immigrants from Kuwait (5.0%, a difference of 0.30%), and Immigrants from Eastern Africa (5.0%, a difference of 0.32%).
| Demographics | Rating | Rank | Unemployment Among Ages 65 to 74 years |
| Czechs | 100.0 /100 | #26 | Exceptional 5.0% |
| Norwegians | 100.0 /100 | #27 | Exceptional 5.0% |
| Bulgarians | 100.0 /100 | #28 | Exceptional 5.0% |
| Ethiopians | 100.0 /100 | #29 | Exceptional 5.0% |
| Immigrants | Lebanon | 100.0 /100 | #30 | Exceptional 5.0% |
| Slovenes | 100.0 /100 | #31 | Exceptional 5.0% |
| Palestinians | 100.0 /100 | #32 | Exceptional 5.0% |
| Belgians | 100.0 /100 | #33 | Exceptional 5.0% |
| Cambodians | 100.0 /100 | #34 | Exceptional 5.0% |
| Bhutanese | 100.0 /100 | #35 | Exceptional 5.0% |
| Immigrants | Kuwait | 99.9 /100 | #36 | Exceptional 5.0% |
| Immigrants | Eastern Africa | 99.9 /100 | #37 | Exceptional 5.0% |
| Nepalese | 99.9 /100 | #38 | Exceptional 5.0% |
| Immigrants | Sweden | 99.9 /100 | #39 | Exceptional 5.0% |
| Immigrants | Iraq | 99.9 /100 | #40 | Exceptional 5.1% |