Eastern European vs Immigrants from North America Unemployment Among Ages 35 to 44 years
COMPARE
Eastern European
Immigrants from North America
Unemployment Among Ages 35 to 44 years
Unemployment Among Ages 35 to 44 years Comparison
Eastern Europeans
Immigrants from North America
4.3%
UNEMPLOYMENT AMONG AGES 35 TO 44 YEARS
98.7/ 100
METRIC RATING
43rd/ 347
METRIC RANK
4.5%
UNEMPLOYMENT AMONG AGES 35 TO 44 YEARS
91.1/ 100
METRIC RATING
106th/ 347
METRIC RANK
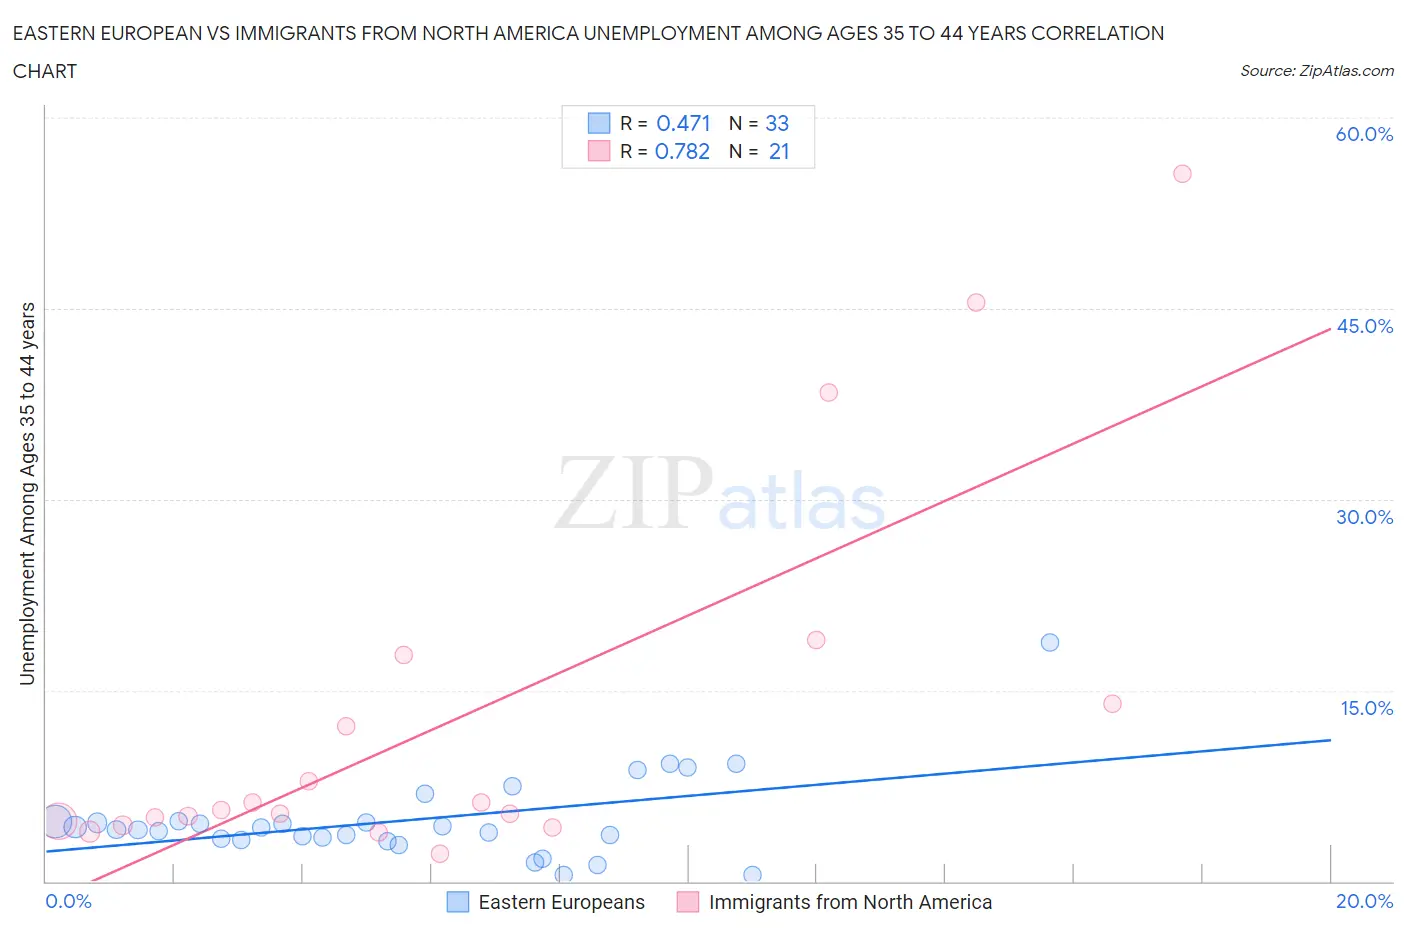
Eastern European vs Immigrants from North America Unemployment Among Ages 35 to 44 years Correlation Chart
The statistical analysis conducted on geographies consisting of 443,495,673 people shows a moderate positive correlation between the proportion of Eastern Europeans and unemployment rate among population between the ages 35 and 44 in the United States with a correlation coefficient (R) of 0.471 and weighted average of 4.3%. Similarly, the statistical analysis conducted on geographies consisting of 446,294,143 people shows a strong positive correlation between the proportion of Immigrants from North America and unemployment rate among population between the ages 35 and 44 in the United States with a correlation coefficient (R) of 0.782 and weighted average of 4.5%, a difference of 3.8%.
Unemployment Among Ages 35 to 44 years Correlation Summary
| Measurement | Eastern European | Immigrants from North America |
| Minimum | 0.50% | 2.2% |
| Maximum | 18.8% | 55.6% |
| Range | 18.3% | 53.4% |
| Mean | 4.8% | 13.0% |
| Median | 4.1% | 5.6% |
| Interquartile 25% (IQ1) | 3.3% | 4.5% |
| Interquartile 75% (IQ3) | 4.7% | 15.9% |
| Interquartile Range (IQR) | 1.4% | 11.3% |
| Standard Deviation (Sample) | 3.4% | 15.0% |
| Standard Deviation (Population) | 3.3% | 14.6% |
Similar Demographics by Unemployment Among Ages 35 to 44 years
Demographics Similar to Eastern Europeans by Unemployment Among Ages 35 to 44 years
In terms of unemployment among ages 35 to 44 years, the demographic groups most similar to Eastern Europeans are Immigrants from Malaysia (4.3%, a difference of 0.020%), German (4.3%, a difference of 0.070%), Belgian (4.3%, a difference of 0.080%), Zimbabwean (4.3%, a difference of 0.18%), and Palestinian (4.3%, a difference of 0.24%).
| Demographics | Rating | Rank | Unemployment Among Ages 35 to 44 years |
| Mongolians | 98.9 /100 | #36 | Exceptional 4.3% |
| Immigrants | Zimbabwe | 98.9 /100 | #37 | Exceptional 4.3% |
| Burmese | 98.9 /100 | #38 | Exceptional 4.3% |
| Palestinians | 98.8 /100 | #39 | Exceptional 4.3% |
| Zimbabweans | 98.8 /100 | #40 | Exceptional 4.3% |
| Belgians | 98.7 /100 | #41 | Exceptional 4.3% |
| Germans | 98.7 /100 | #42 | Exceptional 4.3% |
| Eastern Europeans | 98.7 /100 | #43 | Exceptional 4.3% |
| Immigrants | Malaysia | 98.7 /100 | #44 | Exceptional 4.3% |
| Immigrants | Korea | 98.4 /100 | #45 | Exceptional 4.3% |
| Immigrants | Belgium | 98.4 /100 | #46 | Exceptional 4.3% |
| British | 98.3 /100 | #47 | Exceptional 4.4% |
| Bhutanese | 98.2 /100 | #48 | Exceptional 4.4% |
| Swiss | 98.2 /100 | #49 | Exceptional 4.4% |
| Immigrants | Turkey | 97.8 /100 | #50 | Exceptional 4.4% |
Demographics Similar to Immigrants from North America by Unemployment Among Ages 35 to 44 years
In terms of unemployment among ages 35 to 44 years, the demographic groups most similar to Immigrants from North America are Immigrants from Saudi Arabia (4.5%, a difference of 0.030%), Finnish (4.5%, a difference of 0.090%), Immigrants from North Macedonia (4.5%, a difference of 0.090%), Welsh (4.5%, a difference of 0.11%), and Immigrants from Sudan (4.5%, a difference of 0.14%).
| Demographics | Rating | Rank | Unemployment Among Ages 35 to 44 years |
| Immigrants | Egypt | 92.3 /100 | #99 | Exceptional 4.5% |
| Italians | 91.9 /100 | #100 | Exceptional 4.5% |
| Immigrants | Netherlands | 91.9 /100 | #101 | Exceptional 4.5% |
| Immigrants | Sudan | 91.8 /100 | #102 | Exceptional 4.5% |
| Welsh | 91.6 /100 | #103 | Exceptional 4.5% |
| Finns | 91.6 /100 | #104 | Exceptional 4.5% |
| Immigrants | Saudi Arabia | 91.3 /100 | #105 | Exceptional 4.5% |
| Immigrants | North America | 91.1 /100 | #106 | Exceptional 4.5% |
| Immigrants | North Macedonia | 90.7 /100 | #107 | Exceptional 4.5% |
| New Zealanders | 90.3 /100 | #108 | Exceptional 4.5% |
| Romanians | 90.3 /100 | #109 | Exceptional 4.5% |
| Immigrants | Kazakhstan | 90.0 /100 | #110 | Excellent 4.5% |
| Immigrants | Nicaragua | 89.8 /100 | #111 | Excellent 4.5% |
| Immigrants | Czechoslovakia | 89.2 /100 | #112 | Excellent 4.5% |
| Immigrants | Italy | 88.4 /100 | #113 | Excellent 4.5% |