Eastern European vs Immigrants from Eastern Africa Unemployment Among Ages 16 to 19 years
COMPARE
Eastern European
Immigrants from Eastern Africa
Unemployment Among Ages 16 to 19 years
Unemployment Among Ages 16 to 19 years Comparison
Eastern Europeans
Immigrants from Eastern Africa
17.6%
UNEMPLOYMENT AMONG AGES 16 TO 19 YEARS
44.3/ 100
METRIC RATING
184th/ 347
METRIC RANK
16.8%
UNEMPLOYMENT AMONG AGES 16 TO 19 YEARS
98.1/ 100
METRIC RATING
74th/ 347
METRIC RANK
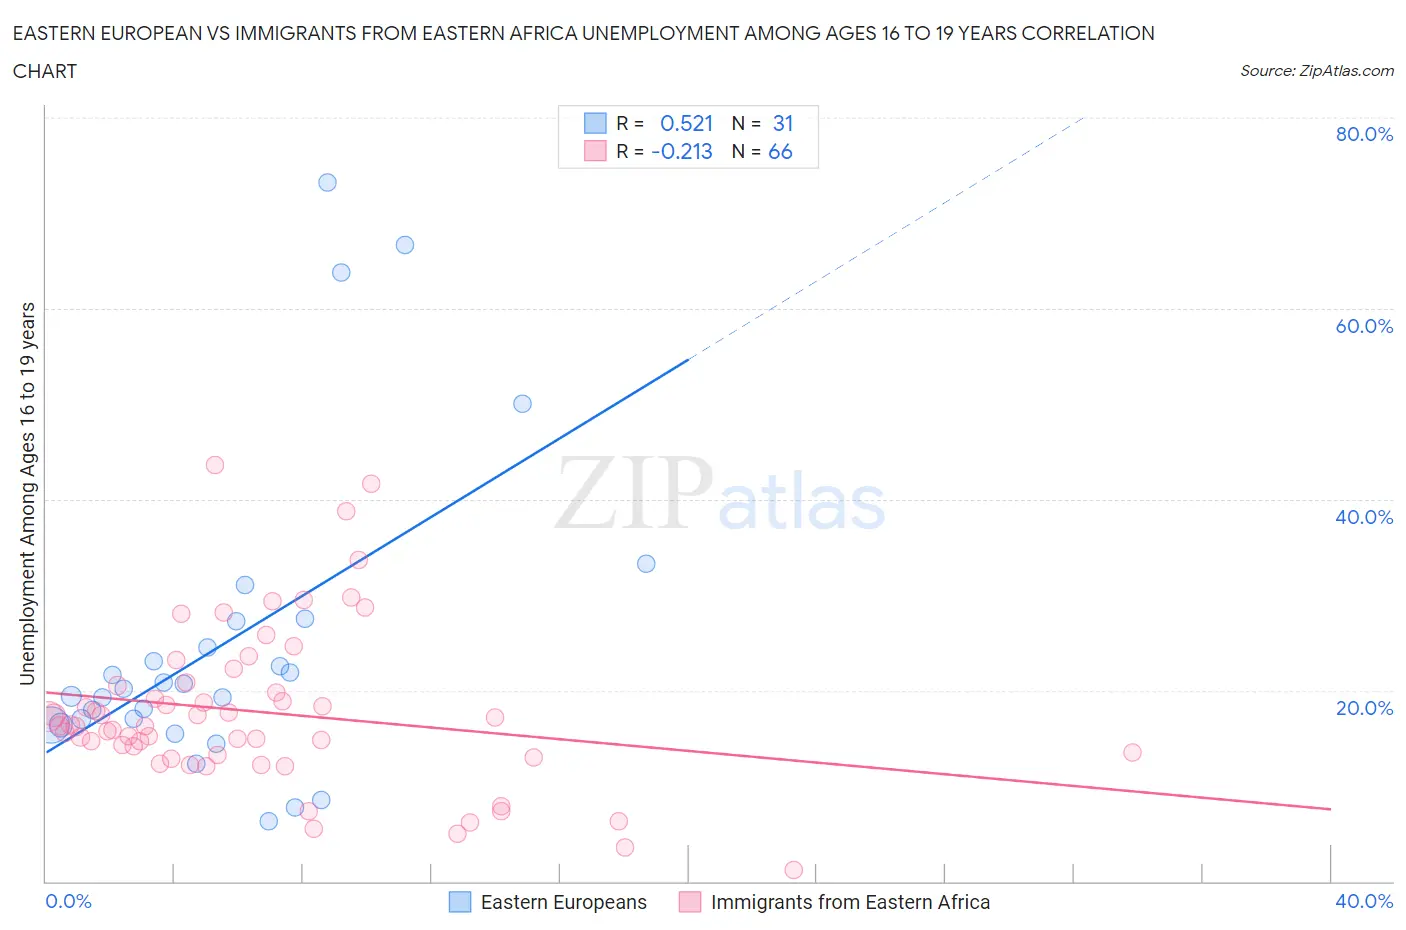
Eastern European vs Immigrants from Eastern Africa Unemployment Among Ages 16 to 19 years Correlation Chart
The statistical analysis conducted on geographies consisting of 427,327,922 people shows a substantial positive correlation between the proportion of Eastern Europeans and unemployment rate among population between the ages 16 and 19 in the United States with a correlation coefficient (R) of 0.521 and weighted average of 17.6%. Similarly, the statistical analysis conducted on geographies consisting of 341,043,772 people shows a weak negative correlation between the proportion of Immigrants from Eastern Africa and unemployment rate among population between the ages 16 and 19 in the United States with a correlation coefficient (R) of -0.213 and weighted average of 16.8%, a difference of 5.2%.
Unemployment Among Ages 16 to 19 years Correlation Summary
| Measurement | Eastern European | Immigrants from Eastern Africa |
| Minimum | 6.2% | 1.2% |
| Maximum | 73.2% | 43.5% |
| Range | 67.0% | 42.3% |
| Mean | 24.9% | 17.7% |
| Median | 20.1% | 16.3% |
| Interquartile 25% (IQ1) | 16.4% | 13.3% |
| Interquartile 75% (IQ3) | 27.2% | 20.5% |
| Interquartile Range (IQR) | 10.8% | 7.2% |
| Standard Deviation (Sample) | 16.5% | 8.4% |
| Standard Deviation (Population) | 16.2% | 8.4% |
Similar Demographics by Unemployment Among Ages 16 to 19 years
Demographics Similar to Eastern Europeans by Unemployment Among Ages 16 to 19 years
In terms of unemployment among ages 16 to 19 years, the demographic groups most similar to Eastern Europeans are Immigrants from Uruguay (17.6%, a difference of 0.020%), Iroquois (17.6%, a difference of 0.040%), Russian (17.6%, a difference of 0.050%), Japanese (17.6%, a difference of 0.050%), and Immigrants from Turkey (17.6%, a difference of 0.060%).
| Demographics | Rating | Rank | Unemployment Among Ages 16 to 19 years |
| Bermudans | 48.7 /100 | #177 | Average 17.6% |
| Celtics | 48.7 /100 | #178 | Average 17.6% |
| Americans | 47.4 /100 | #179 | Average 17.6% |
| Spaniards | 47.1 /100 | #180 | Average 17.6% |
| Immigrants | Turkey | 45.6 /100 | #181 | Average 17.6% |
| Russians | 45.2 /100 | #182 | Average 17.6% |
| Immigrants | Uruguay | 44.6 /100 | #183 | Average 17.6% |
| Eastern Europeans | 44.3 /100 | #184 | Average 17.6% |
| Iroquois | 43.4 /100 | #185 | Average 17.6% |
| Japanese | 43.2 /100 | #186 | Average 17.6% |
| Immigrants | Micronesia | 42.4 /100 | #187 | Average 17.6% |
| Immigrants | Nicaragua | 42.2 /100 | #188 | Average 17.6% |
| Immigrants | Europe | 41.8 /100 | #189 | Average 17.6% |
| Marshallese | 41.7 /100 | #190 | Average 17.6% |
| Immigrants | Costa Rica | 41.3 /100 | #191 | Average 17.6% |
Demographics Similar to Immigrants from Eastern Africa by Unemployment Among Ages 16 to 19 years
In terms of unemployment among ages 16 to 19 years, the demographic groups most similar to Immigrants from Eastern Africa are Lithuanian (16.7%, a difference of 0.030%), New Zealander (16.8%, a difference of 0.060%), Immigrants from North America (16.8%, a difference of 0.13%), Immigrants from Singapore (16.8%, a difference of 0.20%), and Soviet Union (16.8%, a difference of 0.21%).
| Demographics | Rating | Rank | Unemployment Among Ages 16 to 19 years |
| Slavs | 98.7 /100 | #67 | Exceptional 16.7% |
| Chickasaw | 98.7 /100 | #68 | Exceptional 16.7% |
| Serbians | 98.7 /100 | #69 | Exceptional 16.7% |
| Austrians | 98.6 /100 | #70 | Exceptional 16.7% |
| Latvians | 98.5 /100 | #71 | Exceptional 16.7% |
| Immigrants | Canada | 98.5 /100 | #72 | Exceptional 16.7% |
| Lithuanians | 98.2 /100 | #73 | Exceptional 16.7% |
| Immigrants | Eastern Africa | 98.1 /100 | #74 | Exceptional 16.8% |
| New Zealanders | 98.0 /100 | #75 | Exceptional 16.8% |
| Immigrants | North America | 97.9 /100 | #76 | Exceptional 16.8% |
| Immigrants | Singapore | 97.8 /100 | #77 | Exceptional 16.8% |
| Soviet Union | 97.8 /100 | #78 | Exceptional 16.8% |
| Slovaks | 97.5 /100 | #79 | Exceptional 16.8% |
| French Canadians | 97.5 /100 | #80 | Exceptional 16.8% |
| Immigrants | Latvia | 97.5 /100 | #81 | Exceptional 16.8% |