Eastern European vs Hmong Unemployment Among Women with Children Under 18 years
COMPARE
Eastern European
Hmong
Unemployment Among Women with Children Under 18 years
Unemployment Among Women with Children Under 18 years Comparison
Eastern Europeans
Hmong
5.0%
UNEMPLOYMENT AMONG WOMEN WITH CHILDREN UNDER 18 YEARS
98.9/ 100
METRIC RATING
42nd/ 347
METRIC RANK
4.5%
UNEMPLOYMENT AMONG WOMEN WITH CHILDREN UNDER 18 YEARS
100.0/ 100
METRIC RATING
2nd/ 347
METRIC RANK
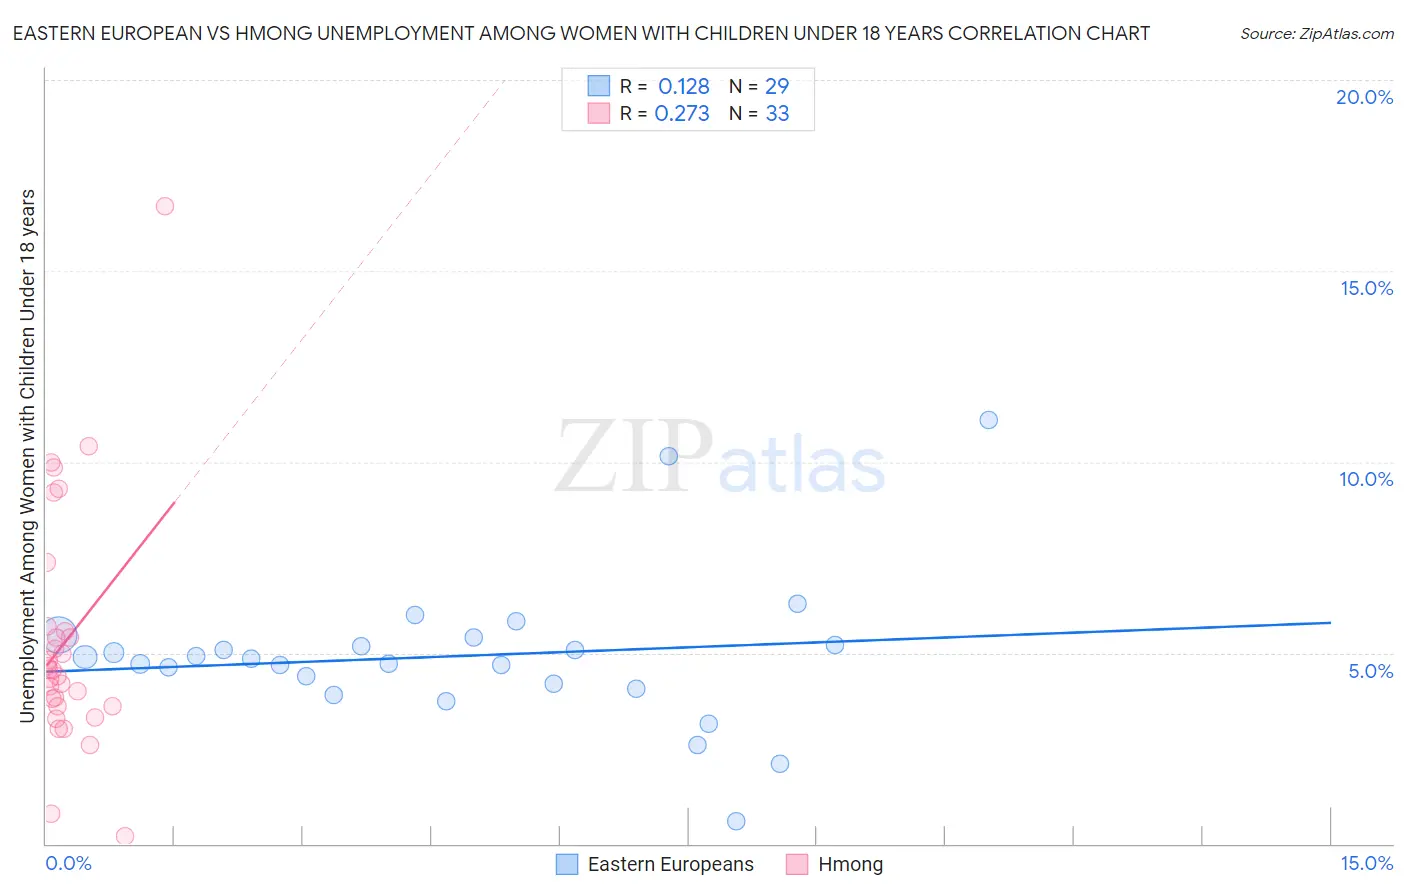
Eastern European vs Hmong Unemployment Among Women with Children Under 18 years Correlation Chart
The statistical analysis conducted on geographies consisting of 432,926,663 people shows a poor positive correlation between the proportion of Eastern Europeans and unemployment rate among women with children under the age of 18 in the United States with a correlation coefficient (R) of 0.128 and weighted average of 5.0%. Similarly, the statistical analysis conducted on geographies consisting of 24,592,032 people shows a weak positive correlation between the proportion of Hmong and unemployment rate among women with children under the age of 18 in the United States with a correlation coefficient (R) of 0.273 and weighted average of 4.5%, a difference of 11.4%.
Unemployment Among Women with Children Under 18 years Correlation Summary
| Measurement | Eastern European | Hmong |
| Minimum | 0.60% | 0.20% |
| Maximum | 11.1% | 16.7% |
| Range | 10.5% | 16.5% |
| Mean | 4.9% | 5.3% |
| Median | 4.8% | 4.6% |
| Interquartile 25% (IQ1) | 4.1% | 3.6% |
| Interquartile 75% (IQ3) | 5.3% | 5.6% |
| Interquartile Range (IQR) | 1.2% | 2.0% |
| Standard Deviation (Sample) | 2.0% | 3.2% |
| Standard Deviation (Population) | 1.9% | 3.1% |
Similar Demographics by Unemployment Among Women with Children Under 18 years
Demographics Similar to Eastern Europeans by Unemployment Among Women with Children Under 18 years
In terms of unemployment among women with children under 18 years, the demographic groups most similar to Eastern Europeans are Turkish (5.0%, a difference of 0.050%), Immigrants from Bosnia and Herzegovina (5.0%, a difference of 0.080%), Immigrants from Moldova (5.0%, a difference of 0.11%), Greek (5.0%, a difference of 0.14%), and Immigrants from Malaysia (5.0%, a difference of 0.20%).
| Demographics | Rating | Rank | Unemployment Among Women with Children Under 18 years |
| Luxembourgers | 99.2 /100 | #35 | Exceptional 5.0% |
| Mongolians | 99.2 /100 | #36 | Exceptional 5.0% |
| Poles | 99.2 /100 | #37 | Exceptional 5.0% |
| Bhutanese | 99.2 /100 | #38 | Exceptional 5.0% |
| English | 99.1 /100 | #39 | Exceptional 5.0% |
| Greeks | 99.0 /100 | #40 | Exceptional 5.0% |
| Immigrants | Bosnia and Herzegovina | 99.0 /100 | #41 | Exceptional 5.0% |
| Eastern Europeans | 98.9 /100 | #42 | Exceptional 5.0% |
| Turks | 98.9 /100 | #43 | Exceptional 5.0% |
| Immigrants | Moldova | 98.9 /100 | #44 | Exceptional 5.0% |
| Immigrants | Malaysia | 98.8 /100 | #45 | Exceptional 5.0% |
| Immigrants | Korea | 98.7 /100 | #46 | Exceptional 5.0% |
| British | 98.7 /100 | #47 | Exceptional 5.0% |
| Northern Europeans | 98.6 /100 | #48 | Exceptional 5.0% |
| Lithuanians | 98.4 /100 | #49 | Exceptional 5.0% |
Demographics Similar to Hmong by Unemployment Among Women with Children Under 18 years
In terms of unemployment among women with children under 18 years, the demographic groups most similar to Hmong are Danish (4.5%, a difference of 0.97%), Norwegian (4.4%, a difference of 2.3%), Swedish (4.7%, a difference of 3.6%), Tongan (4.7%, a difference of 3.6%), and Immigrants from Taiwan (4.7%, a difference of 3.7%).
| Demographics | Rating | Rank | Unemployment Among Women with Children Under 18 years |
| Norwegians | 100.0 /100 | #1 | Exceptional 4.4% |
| Hmong | 100.0 /100 | #2 | Exceptional 4.5% |
| Danes | 100.0 /100 | #3 | Exceptional 4.5% |
| Swedes | 100.0 /100 | #4 | Exceptional 4.7% |
| Tongans | 100.0 /100 | #5 | Exceptional 4.7% |
| Immigrants | Taiwan | 100.0 /100 | #6 | Exceptional 4.7% |
| Immigrants | India | 100.0 /100 | #7 | Exceptional 4.7% |
| Immigrants | Hong Kong | 100.0 /100 | #8 | Exceptional 4.7% |
| Okinawans | 99.9 /100 | #9 | Exceptional 4.7% |
| Czechs | 99.9 /100 | #10 | Exceptional 4.7% |
| Filipinos | 99.9 /100 | #11 | Exceptional 4.8% |
| Scandinavians | 99.9 /100 | #12 | Exceptional 4.8% |
| Bulgarians | 99.9 /100 | #13 | Exceptional 4.8% |
| Cambodians | 99.9 /100 | #14 | Exceptional 4.8% |
| Thais | 99.8 /100 | #15 | Exceptional 4.8% |