Dutch West Indian vs French American Indian Unemployment Among Ages 65 to 74 years
COMPARE
Dutch West Indian
French American Indian
Unemployment Among Ages 65 to 74 years
Unemployment Among Ages 65 to 74 years Comparison
Dutch West Indians
French American Indians
5.5%
UNEMPLOYMENT AMONG AGES 65 TO 74 YEARS
11.5/ 100
METRIC RATING
208th/ 347
METRIC RANK
5.5%
UNEMPLOYMENT AMONG AGES 65 TO 74 YEARS
2.2/ 100
METRIC RATING
234th/ 347
METRIC RANK
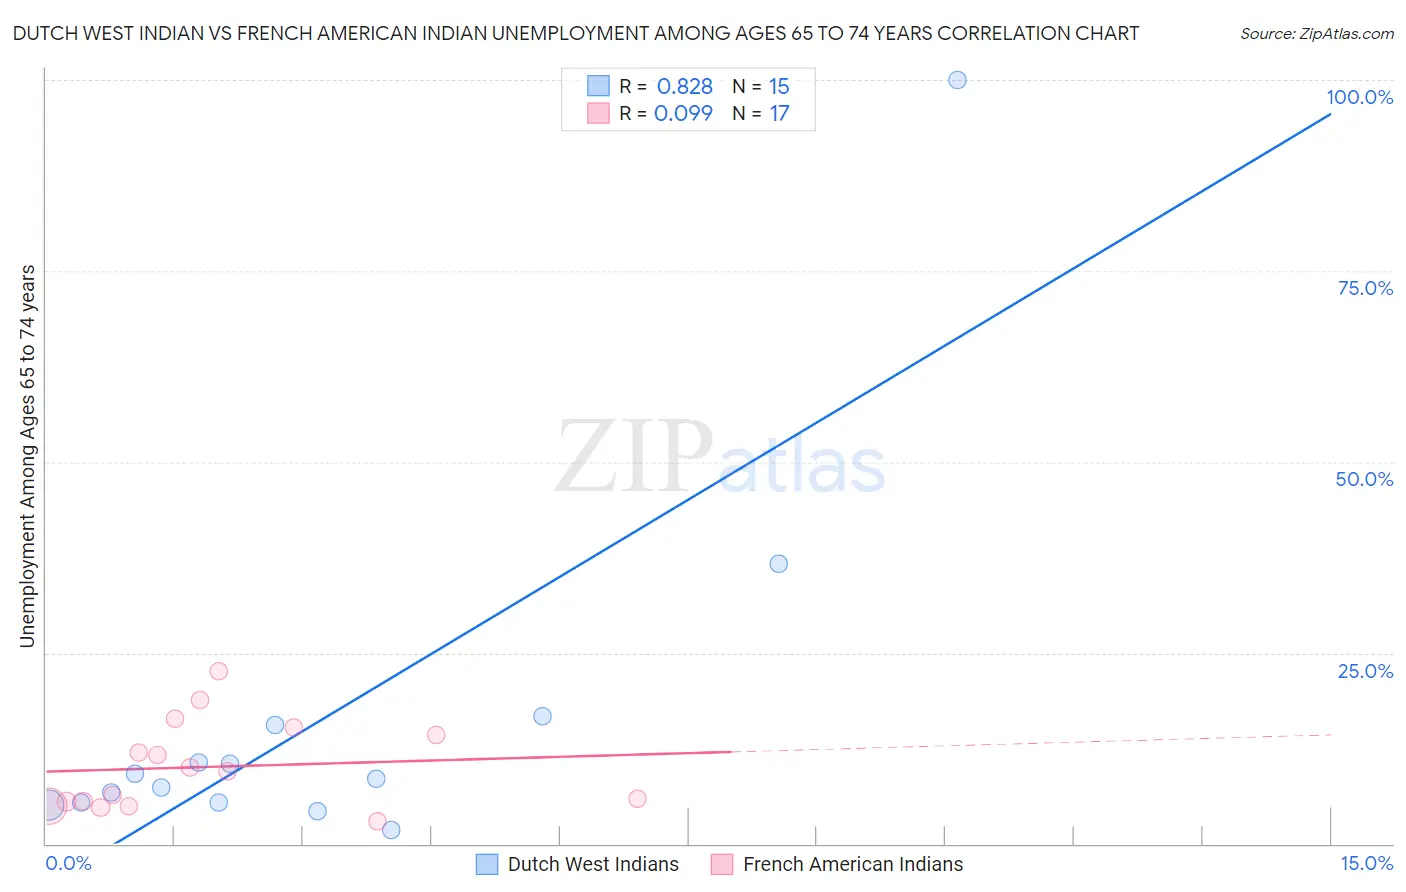
Dutch West Indian vs French American Indian Unemployment Among Ages 65 to 74 years Correlation Chart
The statistical analysis conducted on geographies consisting of 78,689,705 people shows a very strong positive correlation between the proportion of Dutch West Indians and unemployment rate among population between the ages 65 and 74 in the United States with a correlation coefficient (R) of 0.828 and weighted average of 5.5%. Similarly, the statistical analysis conducted on geographies consisting of 121,983,342 people shows a slight positive correlation between the proportion of French American Indians and unemployment rate among population between the ages 65 and 74 in the United States with a correlation coefficient (R) of 0.099 and weighted average of 5.5%, a difference of 1.4%.
Unemployment Among Ages 65 to 74 years Correlation Summary
| Measurement | Dutch West Indian | French American Indian |
| Minimum | 1.8% | 2.9% |
| Maximum | 100.0% | 22.6% |
| Range | 98.2% | 19.7% |
| Mean | 16.2% | 10.1% |
| Median | 8.6% | 9.5% |
| Interquartile 25% (IQ1) | 5.4% | 5.3% |
| Interquartile 75% (IQ3) | 15.5% | 14.7% |
| Interquartile Range (IQR) | 10.2% | 9.5% |
| Standard Deviation (Sample) | 24.6% | 5.7% |
| Standard Deviation (Population) | 23.8% | 5.6% |
Similar Demographics by Unemployment Among Ages 65 to 74 years
Demographics Similar to Dutch West Indians by Unemployment Among Ages 65 to 74 years
In terms of unemployment among ages 65 to 74 years, the demographic groups most similar to Dutch West Indians are Immigrants from Uzbekistan (5.5%, a difference of 0.080%), Immigrants from Honduras (5.5%, a difference of 0.090%), African (5.5%, a difference of 0.11%), Immigrants from Northern Africa (5.5%, a difference of 0.12%), and Icelander (5.4%, a difference of 0.20%).
| Demographics | Rating | Rank | Unemployment Among Ages 65 to 74 years |
| Immigrants | Western Asia | 14.9 /100 | #201 | Poor 5.4% |
| Sub-Saharan Africans | 14.4 /100 | #202 | Poor 5.4% |
| Argentineans | 14.3 /100 | #203 | Poor 5.4% |
| Seminole | 14.3 /100 | #204 | Poor 5.4% |
| Icelanders | 14.2 /100 | #205 | Poor 5.4% |
| Africans | 12.8 /100 | #206 | Poor 5.5% |
| Immigrants | Uzbekistan | 12.5 /100 | #207 | Poor 5.5% |
| Dutch West Indians | 11.5 /100 | #208 | Poor 5.5% |
| Immigrants | Honduras | 10.4 /100 | #209 | Poor 5.5% |
| Immigrants | Northern Africa | 10.1 /100 | #210 | Poor 5.5% |
| Immigrants | Croatia | 9.1 /100 | #211 | Tragic 5.5% |
| Haitians | 7.7 /100 | #212 | Tragic 5.5% |
| Italians | 7.7 /100 | #213 | Tragic 5.5% |
| Egyptians | 7.6 /100 | #214 | Tragic 5.5% |
| Americans | 7.3 /100 | #215 | Tragic 5.5% |
Demographics Similar to French American Indians by Unemployment Among Ages 65 to 74 years
In terms of unemployment among ages 65 to 74 years, the demographic groups most similar to French American Indians are Peruvian (5.5%, a difference of 0.0%), Hopi (5.5%, a difference of 0.010%), South American Indian (5.5%, a difference of 0.020%), Immigrants from Belize (5.5%, a difference of 0.020%), and Nigerian (5.5%, a difference of 0.10%).
| Demographics | Rating | Rank | Unemployment Among Ages 65 to 74 years |
| Immigrants | Albania | 3.7 /100 | #227 | Tragic 5.5% |
| Immigrants | Israel | 3.0 /100 | #228 | Tragic 5.5% |
| West Indians | 2.7 /100 | #229 | Tragic 5.5% |
| Immigrants | Caribbean | 2.7 /100 | #230 | Tragic 5.5% |
| Israelis | 2.5 /100 | #231 | Tragic 5.5% |
| Nigerians | 2.5 /100 | #232 | Tragic 5.5% |
| South American Indians | 2.3 /100 | #233 | Tragic 5.5% |
| French American Indians | 2.2 /100 | #234 | Tragic 5.5% |
| Peruvians | 2.2 /100 | #235 | Tragic 5.5% |
| Hopi | 2.2 /100 | #236 | Tragic 5.5% |
| Immigrants | Belize | 2.2 /100 | #237 | Tragic 5.5% |
| Cajuns | 1.8 /100 | #238 | Tragic 5.5% |
| German Russians | 1.6 /100 | #239 | Tragic 5.5% |
| Ghanaians | 1.4 /100 | #240 | Tragic 5.6% |
| Cree | 1.4 /100 | #241 | Tragic 5.6% |