Dutch vs Thai Unemployment Among Ages 16 to 19 years
COMPARE
Dutch
Thai
Unemployment Among Ages 16 to 19 years
Unemployment Among Ages 16 to 19 years Comparison
Dutch
Thais
15.9%
UNEMPLOYMENT AMONG AGES 16 TO 19 YEARS
100.0/ 100
METRIC RATING
26th/ 347
METRIC RANK
15.7%
UNEMPLOYMENT AMONG AGES 16 TO 19 YEARS
100.0/ 100
METRIC RATING
18th/ 347
METRIC RANK
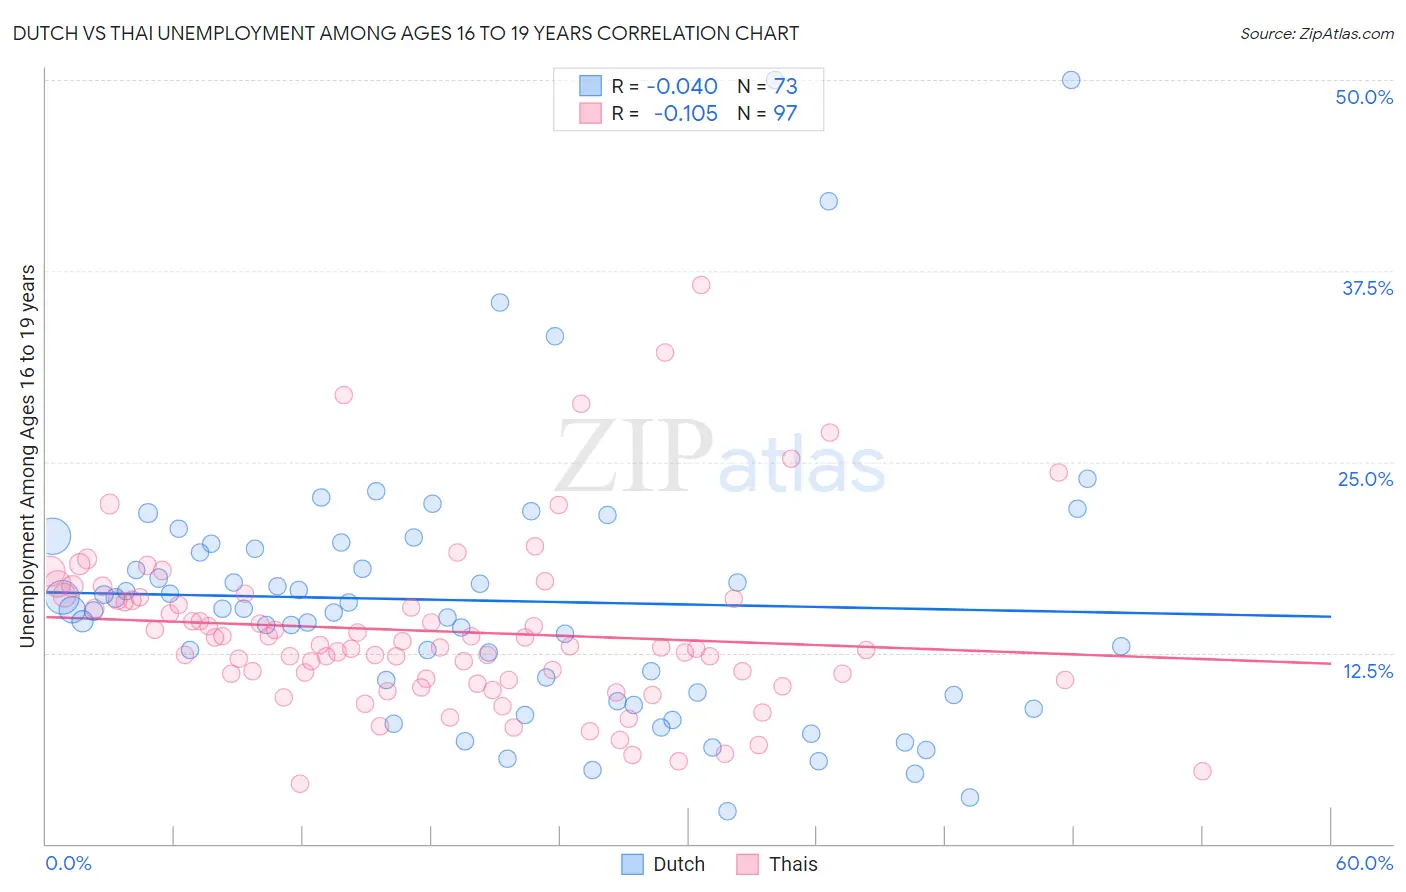
Dutch vs Thai Unemployment Among Ages 16 to 19 years Correlation Chart
The statistical analysis conducted on geographies consisting of 496,963,635 people shows no correlation between the proportion of Dutch and unemployment rate among population between the ages 16 and 19 in the United States with a correlation coefficient (R) of -0.040 and weighted average of 15.9%. Similarly, the statistical analysis conducted on geographies consisting of 446,293,569 people shows a poor negative correlation between the proportion of Thais and unemployment rate among population between the ages 16 and 19 in the United States with a correlation coefficient (R) of -0.105 and weighted average of 15.7%, a difference of 1.3%.
Unemployment Among Ages 16 to 19 years Correlation Summary
| Measurement | Dutch | Thai |
| Minimum | 2.1% | 3.9% |
| Maximum | 50.0% | 36.6% |
| Range | 47.9% | 32.7% |
| Mean | 15.9% | 13.9% |
| Median | 15.3% | 12.8% |
| Interquartile 25% (IQ1) | 9.5% | 10.7% |
| Interquartile 75% (IQ3) | 19.5% | 16.0% |
| Interquartile Range (IQR) | 10.0% | 5.3% |
| Standard Deviation (Sample) | 9.1% | 5.7% |
| Standard Deviation (Population) | 9.1% | 5.6% |
Demographics Similar to Dutch and Thais by Unemployment Among Ages 16 to 19 years
In terms of unemployment among ages 16 to 19 years, the demographic groups most similar to Dutch are Filipino (15.9%, a difference of 0.070%), Tongan (15.9%, a difference of 0.16%), Belgian (15.9%, a difference of 0.32%), Finnish (15.9%, a difference of 0.36%), and Immigrants from Sudan (16.0%, a difference of 0.47%). Similarly, the demographic groups most similar to Thais are Swiss (15.8%, a difference of 0.11%), Sudanese (15.8%, a difference of 0.21%), Somali (15.7%, a difference of 0.24%), German (15.7%, a difference of 0.45%), and Immigrants from Taiwan (15.8%, a difference of 0.54%).
| Demographics | Rating | Rank | Unemployment Among Ages 16 to 19 years |
| Taiwanese | 100.0 /100 | #12 | Exceptional 15.5% |
| Immigrants | Burma/Myanmar | 100.0 /100 | #13 | Exceptional 15.6% |
| Immigrants | Zaire | 100.0 /100 | #14 | Exceptional 15.6% |
| Yugoslavians | 100.0 /100 | #15 | Exceptional 15.6% |
| Germans | 100.0 /100 | #16 | Exceptional 15.7% |
| Somalis | 100.0 /100 | #17 | Exceptional 15.7% |
| Thais | 100.0 /100 | #18 | Exceptional 15.7% |
| Swiss | 100.0 /100 | #19 | Exceptional 15.8% |
| Sudanese | 100.0 /100 | #20 | Exceptional 15.8% |
| Immigrants | Taiwan | 100.0 /100 | #21 | Exceptional 15.8% |
| Finns | 100.0 /100 | #22 | Exceptional 15.9% |
| Belgians | 100.0 /100 | #23 | Exceptional 15.9% |
| Tongans | 100.0 /100 | #24 | Exceptional 15.9% |
| Filipinos | 100.0 /100 | #25 | Exceptional 15.9% |
| Dutch | 100.0 /100 | #26 | Exceptional 15.9% |
| Immigrants | Sudan | 99.9 /100 | #27 | Exceptional 16.0% |
| Jordanians | 99.9 /100 | #28 | Exceptional 16.0% |
| Chinese | 99.9 /100 | #29 | Exceptional 16.0% |
| Kenyans | 99.9 /100 | #30 | Exceptional 16.1% |
| English | 99.9 /100 | #31 | Exceptional 16.1% |
| Europeans | 99.9 /100 | #32 | Exceptional 16.1% |