Dutch vs Immigrants from Denmark Unemployment Among Ages 55 to 59 years
COMPARE
Dutch
Immigrants from Denmark
Unemployment Among Ages 55 to 59 years
Unemployment Among Ages 55 to 59 years Comparison
Dutch
Immigrants from Denmark
4.6%
UNEMPLOYMENT AMONG AGES 55 TO 59 YEARS
99.5/ 100
METRIC RATING
60th/ 347
METRIC RANK
4.9%
UNEMPLOYMENT AMONG AGES 55 TO 59 YEARS
10.3/ 100
METRIC RATING
214th/ 347
METRIC RANK
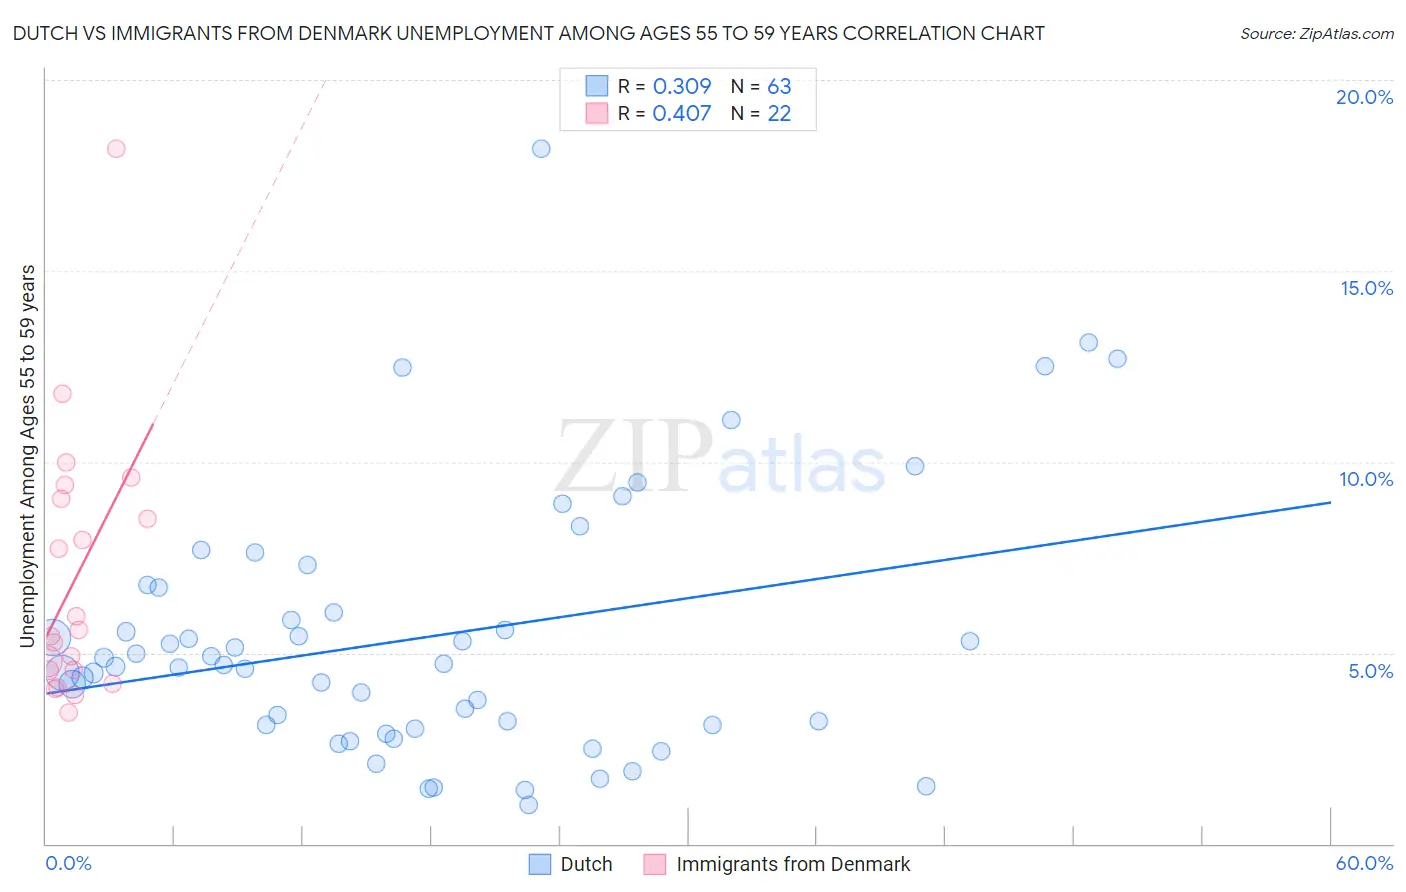
Dutch vs Immigrants from Denmark Unemployment Among Ages 55 to 59 years Correlation Chart
The statistical analysis conducted on geographies consisting of 475,957,020 people shows a mild positive correlation between the proportion of Dutch and unemployment rate among population between the ages 55 and 59 in the United States with a correlation coefficient (R) of 0.309 and weighted average of 4.6%. Similarly, the statistical analysis conducted on geographies consisting of 131,957,916 people shows a moderate positive correlation between the proportion of Immigrants from Denmark and unemployment rate among population between the ages 55 and 59 in the United States with a correlation coefficient (R) of 0.407 and weighted average of 4.9%, a difference of 8.0%.
Unemployment Among Ages 55 to 59 years Correlation Summary
| Measurement | Dutch | Immigrants from Denmark |
| Minimum | 1.0% | 3.4% |
| Maximum | 18.2% | 18.2% |
| Range | 17.2% | 14.8% |
| Mean | 5.4% | 6.9% |
| Median | 4.7% | 5.5% |
| Interquartile 25% (IQ1) | 3.1% | 4.5% |
| Interquartile 75% (IQ3) | 6.7% | 9.0% |
| Interquartile Range (IQR) | 3.6% | 4.5% |
| Standard Deviation (Sample) | 3.4% | 3.5% |
| Standard Deviation (Population) | 3.4% | 3.4% |
Similar Demographics by Unemployment Among Ages 55 to 59 years
Demographics Similar to Dutch by Unemployment Among Ages 55 to 59 years
In terms of unemployment among ages 55 to 59 years, the demographic groups most similar to Dutch are Immigrants from Uganda (4.6%, a difference of 0.050%), Immigrants from Argentina (4.6%, a difference of 0.090%), Okinawan (4.5%, a difference of 0.27%), Northern European (4.5%, a difference of 0.29%), and Welsh (4.5%, a difference of 0.30%).
| Demographics | Rating | Rank | Unemployment Among Ages 55 to 59 years |
| Immigrants | Middle Africa | 99.7 /100 | #53 | Exceptional 4.5% |
| Burmese | 99.7 /100 | #54 | Exceptional 4.5% |
| Immigrants | Nepal | 99.6 /100 | #55 | Exceptional 4.5% |
| Welsh | 99.6 /100 | #56 | Exceptional 4.5% |
| Northern Europeans | 99.6 /100 | #57 | Exceptional 4.5% |
| Okinawans | 99.6 /100 | #58 | Exceptional 4.5% |
| Immigrants | Uganda | 99.5 /100 | #59 | Exceptional 4.6% |
| Dutch | 99.5 /100 | #60 | Exceptional 4.6% |
| Immigrants | Argentina | 99.5 /100 | #61 | Exceptional 4.6% |
| Slovenes | 99.3 /100 | #62 | Exceptional 4.6% |
| Immigrants | South Central Asia | 99.3 /100 | #63 | Exceptional 4.6% |
| Argentineans | 99.1 /100 | #64 | Exceptional 4.6% |
| Sudanese | 99.1 /100 | #65 | Exceptional 4.6% |
| Mongolians | 99.0 /100 | #66 | Exceptional 4.6% |
| Ugandans | 99.0 /100 | #67 | Exceptional 4.6% |
Demographics Similar to Immigrants from Denmark by Unemployment Among Ages 55 to 59 years
In terms of unemployment among ages 55 to 59 years, the demographic groups most similar to Immigrants from Denmark are Bermudan (4.9%, a difference of 0.070%), Nonimmigrants (4.9%, a difference of 0.090%), Syrian (4.9%, a difference of 0.20%), Hawaiian (4.9%, a difference of 0.25%), and Creek (4.9%, a difference of 0.26%).
| Demographics | Rating | Rank | Unemployment Among Ages 55 to 59 years |
| Immigrants | Australia | 14.1 /100 | #207 | Poor 4.9% |
| Immigrants | Kazakhstan | 14.0 /100 | #208 | Poor 4.9% |
| Immigrants | Haiti | 13.3 /100 | #209 | Poor 4.9% |
| Creek | 12.9 /100 | #210 | Poor 4.9% |
| Hawaiians | 12.8 /100 | #211 | Poor 4.9% |
| Immigrants | Nonimmigrants | 11.2 /100 | #212 | Poor 4.9% |
| Bermudans | 11.0 /100 | #213 | Poor 4.9% |
| Immigrants | Denmark | 10.3 /100 | #214 | Poor 4.9% |
| Syrians | 8.6 /100 | #215 | Tragic 4.9% |
| Spanish Americans | 8.1 /100 | #216 | Tragic 4.9% |
| Immigrants | Brazil | 8.1 /100 | #217 | Tragic 4.9% |
| Immigrants | Austria | 8.0 /100 | #218 | Tragic 4.9% |
| Immigrants | Nigeria | 8.0 /100 | #219 | Tragic 4.9% |
| Indians (Asian) | 7.6 /100 | #220 | Tragic 4.9% |
| Nigerians | 7.5 /100 | #221 | Tragic 4.9% |