Danish vs Colville Unemployment Among Ages 55 to 59 years
COMPARE
Danish
Colville
Unemployment Among Ages 55 to 59 years
Unemployment Among Ages 55 to 59 years Comparison
Danes
Colville
4.3%
UNEMPLOYMENT AMONG AGES 55 TO 59 YEARS
100.0/ 100
METRIC RATING
12th/ 347
METRIC RANK
6.7%
UNEMPLOYMENT AMONG AGES 55 TO 59 YEARS
0.0/ 100
METRIC RATING
335th/ 347
METRIC RANK
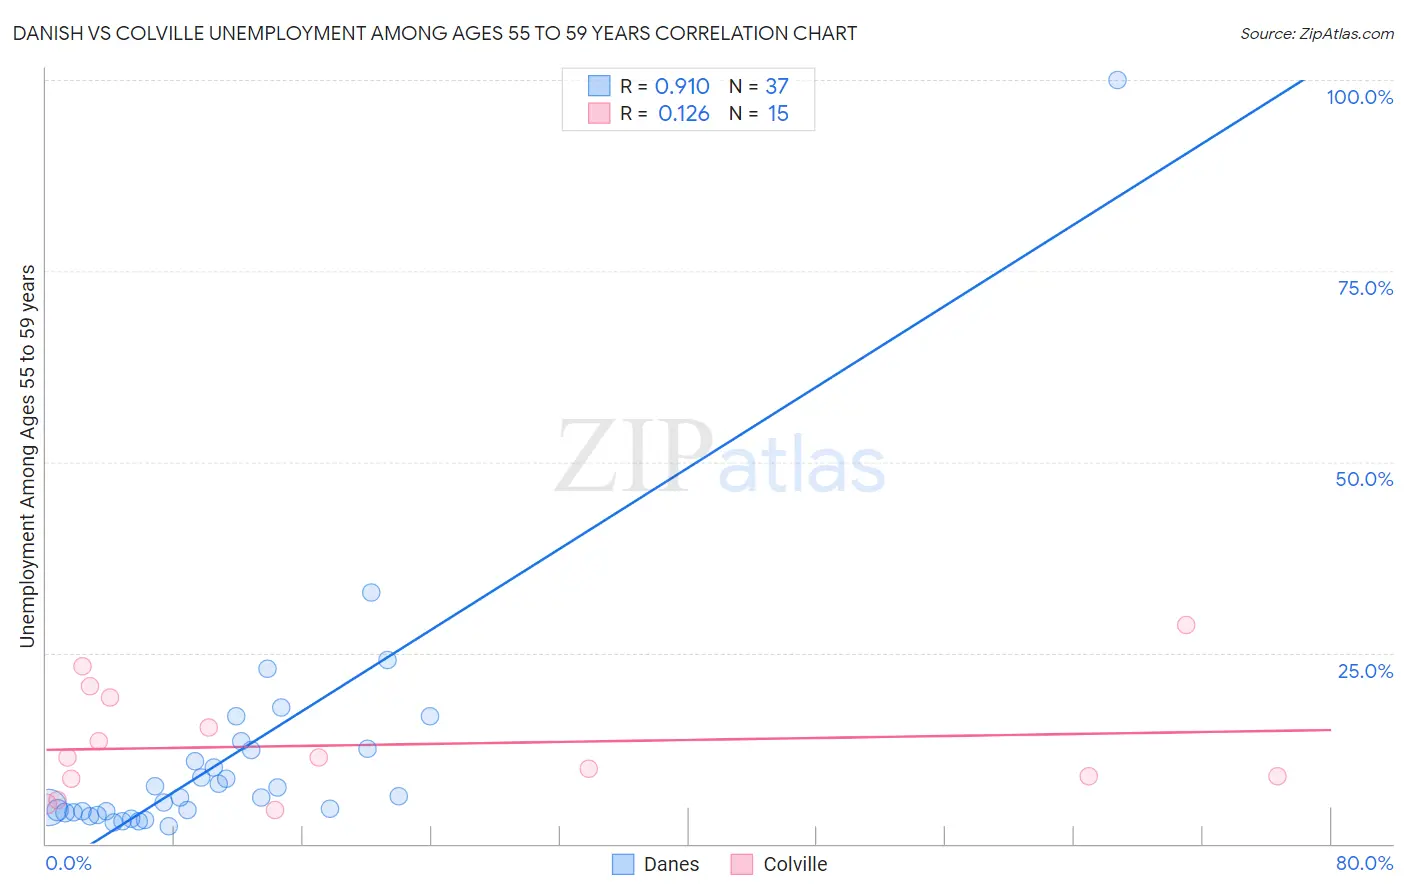
Danish vs Colville Unemployment Among Ages 55 to 59 years Correlation Chart
The statistical analysis conducted on geographies consisting of 423,750,471 people shows a near-perfect positive correlation between the proportion of Danes and unemployment rate among population between the ages 55 and 59 in the United States with a correlation coefficient (R) of 0.910 and weighted average of 4.3%. Similarly, the statistical analysis conducted on geographies consisting of 33,865,695 people shows a poor positive correlation between the proportion of Colville and unemployment rate among population between the ages 55 and 59 in the United States with a correlation coefficient (R) of 0.126 and weighted average of 6.7%, a difference of 55.6%.
Unemployment Among Ages 55 to 59 years Correlation Summary
| Measurement | Danish | Colville |
| Minimum | 2.4% | 4.5% |
| Maximum | 100.0% | 28.6% |
| Range | 97.6% | 24.1% |
| Mean | 11.2% | 13.0% |
| Median | 6.1% | 11.3% |
| Interquartile 25% (IQ1) | 4.1% | 8.6% |
| Interquartile 75% (IQ3) | 12.4% | 19.2% |
| Interquartile Range (IQR) | 8.3% | 10.6% |
| Standard Deviation (Sample) | 16.5% | 7.1% |
| Standard Deviation (Population) | 16.3% | 6.9% |
Similar Demographics by Unemployment Among Ages 55 to 59 years
Demographics Similar to Danes by Unemployment Among Ages 55 to 59 years
In terms of unemployment among ages 55 to 59 years, the demographic groups most similar to Danes are Immigrants from Congo (4.3%, a difference of 0.19%), Indonesian (4.3%, a difference of 0.26%), Immigrants from India (4.3%, a difference of 0.41%), Bulgarian (4.3%, a difference of 0.67%), and Tongan (4.3%, a difference of 0.71%).
| Demographics | Rating | Rank | Unemployment Among Ages 55 to 59 years |
| Immigrants | Bolivia | 100.0 /100 | #5 | Exceptional 4.2% |
| Norwegians | 100.0 /100 | #6 | Exceptional 4.2% |
| Zimbabweans | 100.0 /100 | #7 | Exceptional 4.2% |
| Bolivians | 100.0 /100 | #8 | Exceptional 4.2% |
| Cubans | 100.0 /100 | #9 | Exceptional 4.2% |
| Tongans | 100.0 /100 | #10 | Exceptional 4.3% |
| Immigrants | Congo | 100.0 /100 | #11 | Exceptional 4.3% |
| Danes | 100.0 /100 | #12 | Exceptional 4.3% |
| Indonesians | 100.0 /100 | #13 | Exceptional 4.3% |
| Immigrants | India | 100.0 /100 | #14 | Exceptional 4.3% |
| Bulgarians | 100.0 /100 | #15 | Exceptional 4.3% |
| Somalis | 100.0 /100 | #16 | Exceptional 4.4% |
| Czechs | 100.0 /100 | #17 | Exceptional 4.4% |
| Immigrants | Somalia | 100.0 /100 | #18 | Exceptional 4.4% |
| Chinese | 100.0 /100 | #19 | Exceptional 4.4% |
Demographics Similar to Colville by Unemployment Among Ages 55 to 59 years
In terms of unemployment among ages 55 to 59 years, the demographic groups most similar to Colville are Navajo (6.7%, a difference of 0.15%), Pueblo (6.7%, a difference of 0.18%), Paiute (6.8%, a difference of 0.67%), Pima (6.6%, a difference of 1.4%), and Immigrants from Yemen (6.9%, a difference of 2.6%).
| Demographics | Rating | Rank | Unemployment Among Ages 55 to 59 years |
| Yuman | 0.0 /100 | #328 | Tragic 6.1% |
| Dominicans | 0.0 /100 | #329 | Tragic 6.2% |
| Alaska Natives | 0.0 /100 | #330 | Tragic 6.2% |
| Immigrants | Dominican Republic | 0.0 /100 | #331 | Tragic 6.3% |
| Aleuts | 0.0 /100 | #332 | Tragic 6.4% |
| Pima | 0.0 /100 | #333 | Tragic 6.6% |
| Pueblo | 0.0 /100 | #334 | Tragic 6.7% |
| Colville | 0.0 /100 | #335 | Tragic 6.7% |
| Navajo | 0.0 /100 | #336 | Tragic 6.7% |
| Paiute | 0.0 /100 | #337 | Tragic 6.8% |
| Immigrants | Yemen | 0.0 /100 | #338 | Tragic 6.9% |
| Puerto Ricans | 0.0 /100 | #339 | Tragic 7.0% |
| Alaskan Athabascans | 0.0 /100 | #340 | Tragic 7.1% |
| Shoshone | 0.0 /100 | #341 | Tragic 7.4% |
| Hopi | 0.0 /100 | #342 | Tragic 8.1% |