Czech vs Tsimshian Unemployment Among Youth under 25 years
COMPARE
Czech
Tsimshian
Unemployment Among Youth under 25 years
Unemployment Among Youth under 25 years Comparison
Czechs
Tsimshian
10.3%
UNEMPLOYMENT AMONG YOUTH UNDER 25 YEARS
100.0/ 100
METRIC RATING
5th/ 347
METRIC RANK
16.5%
UNEMPLOYMENT AMONG YOUTH UNDER 25 YEARS
0.0/ 100
METRIC RATING
339th/ 347
METRIC RANK
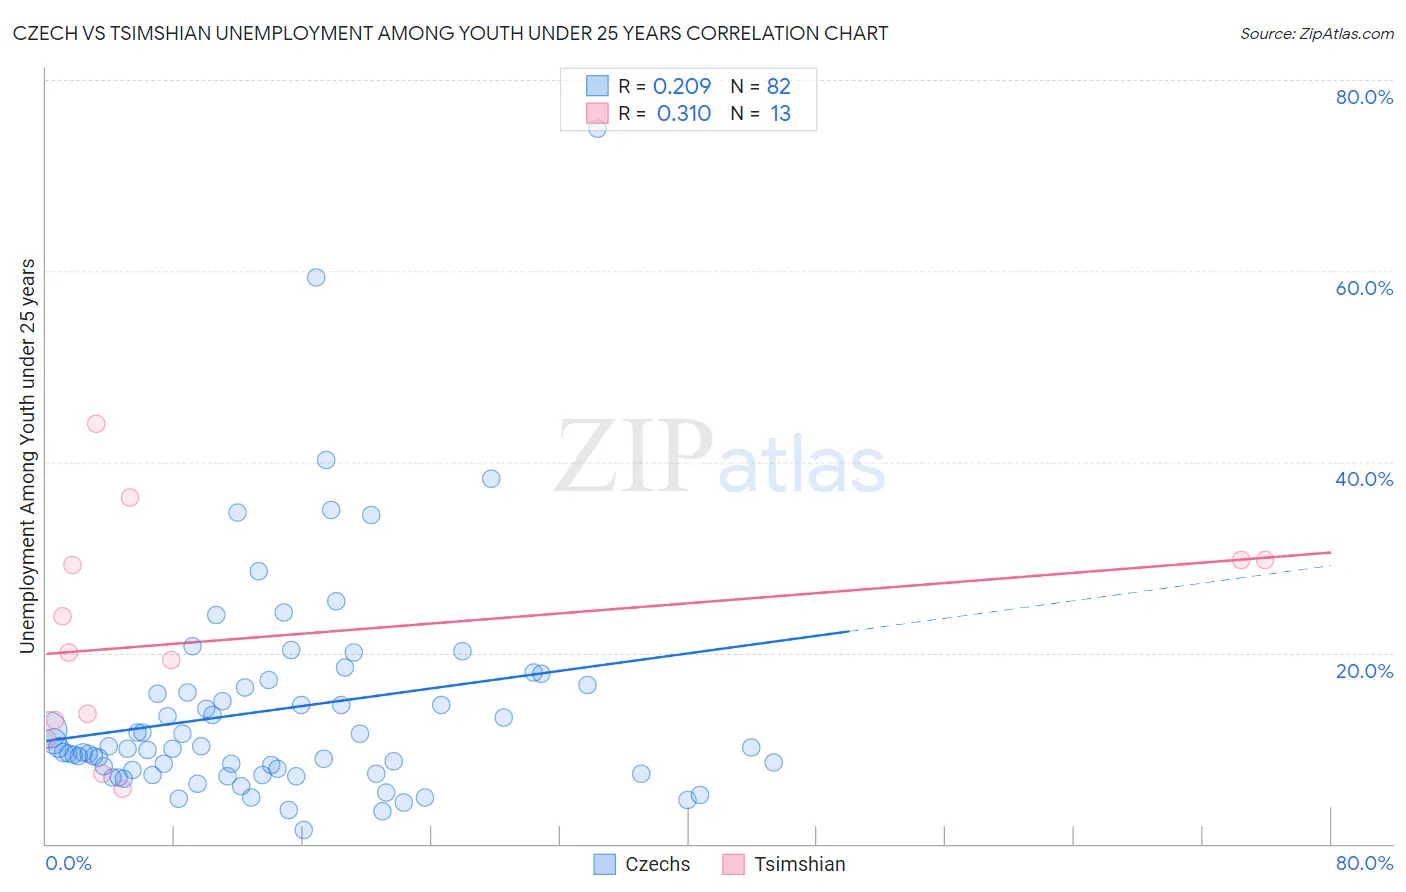
Czech vs Tsimshian Unemployment Among Youth under 25 years Correlation Chart
The statistical analysis conducted on geographies consisting of 471,540,458 people shows a weak positive correlation between the proportion of Czechs and unemployment rate among youth under the age of 25 in the United States with a correlation coefficient (R) of 0.209 and weighted average of 10.3%. Similarly, the statistical analysis conducted on geographies consisting of 15,601,146 people shows a mild positive correlation between the proportion of Tsimshian and unemployment rate among youth under the age of 25 in the United States with a correlation coefficient (R) of 0.310 and weighted average of 16.5%, a difference of 60.1%.
Unemployment Among Youth under 25 years Correlation Summary
| Measurement | Czech | Tsimshian |
| Minimum | 1.4% | 5.7% |
| Maximum | 74.9% | 44.0% |
| Range | 73.5% | 38.3% |
| Mean | 14.1% | 21.7% |
| Median | 10.1% | 20.1% |
| Interquartile 25% (IQ1) | 7.4% | 12.0% |
| Interquartile 75% (IQ3) | 16.3% | 29.7% |
| Interquartile Range (IQR) | 9.0% | 17.7% |
| Standard Deviation (Sample) | 11.8% | 11.6% |
| Standard Deviation (Population) | 11.7% | 11.2% |
Similar Demographics by Unemployment Among Youth under 25 years
Demographics Similar to Czechs by Unemployment Among Youth under 25 years
In terms of unemployment among youth under 25 years, the demographic groups most similar to Czechs are Danish (10.3%, a difference of 0.16%), Swedish (10.4%, a difference of 0.91%), Zimbabwean (10.2%, a difference of 1.1%), Immigrants from Venezuela (10.5%, a difference of 1.7%), and German (10.5%, a difference of 2.1%).
| Demographics | Rating | Rank | Unemployment Among Youth under 25 years |
| Norwegians | 100.0 /100 | #1 | Exceptional 9.8% |
| Immigrants | Cuba | 100.0 /100 | #2 | Exceptional 10.0% |
| Luxembourgers | 100.0 /100 | #3 | Exceptional 10.0% |
| Zimbabweans | 100.0 /100 | #4 | Exceptional 10.2% |
| Czechs | 100.0 /100 | #5 | Exceptional 10.3% |
| Danes | 100.0 /100 | #6 | Exceptional 10.3% |
| Swedes | 100.0 /100 | #7 | Exceptional 10.4% |
| Immigrants | Venezuela | 100.0 /100 | #8 | Exceptional 10.5% |
| Germans | 100.0 /100 | #9 | Exceptional 10.5% |
| Immigrants | Somalia | 100.0 /100 | #10 | Exceptional 10.5% |
| Scandinavians | 100.0 /100 | #11 | Exceptional 10.5% |
| Immigrants | Sudan | 100.0 /100 | #12 | Exceptional 10.5% |
| Indonesians | 100.0 /100 | #13 | Exceptional 10.6% |
| Cubans | 100.0 /100 | #14 | Exceptional 10.6% |
| Sudanese | 100.0 /100 | #15 | Exceptional 10.6% |
Demographics Similar to Tsimshian by Unemployment Among Youth under 25 years
In terms of unemployment among youth under 25 years, the demographic groups most similar to Tsimshian are Yuman (16.3%, a difference of 1.0%), Arapaho (16.3%, a difference of 1.3%), Pima (16.2%, a difference of 1.5%), Colville (16.8%, a difference of 1.7%), and Immigrants from St. Vincent and the Grenadines (16.1%, a difference of 2.1%).
| Demographics | Rating | Rank | Unemployment Among Youth under 25 years |
| Immigrants | Grenada | 0.0 /100 | #332 | Tragic 15.8% |
| Guyanese | 0.0 /100 | #333 | Tragic 15.9% |
| Immigrants | Guyana | 0.0 /100 | #334 | Tragic 15.9% |
| Immigrants | St. Vincent and the Grenadines | 0.0 /100 | #335 | Tragic 16.1% |
| Pima | 0.0 /100 | #336 | Tragic 16.2% |
| Arapaho | 0.0 /100 | #337 | Tragic 16.3% |
| Yuman | 0.0 /100 | #338 | Tragic 16.3% |
| Tsimshian | 0.0 /100 | #339 | Tragic 16.5% |
| Colville | 0.0 /100 | #340 | Tragic 16.8% |
| Paiute | 0.0 /100 | #341 | Tragic 17.6% |
| Puerto Ricans | 0.0 /100 | #342 | Tragic 18.4% |
| Navajo | 0.0 /100 | #343 | Tragic 18.6% |
| Crow | 0.0 /100 | #344 | Tragic 20.1% |
| Hopi | 0.0 /100 | #345 | Tragic 21.5% |
| Inupiat | 0.0 /100 | #346 | Tragic 22.0% |