Czechoslovakian vs Swiss Unemployment Among Ages 55 to 59 years
COMPARE
Czechoslovakian
Swiss
Unemployment Among Ages 55 to 59 years
Unemployment Among Ages 55 to 59 years Comparison
Czechoslovakians
Swiss
4.6%
UNEMPLOYMENT AMONG AGES 55 TO 59 YEARS
99.0/ 100
METRIC RATING
69th/ 347
METRIC RANK
4.5%
UNEMPLOYMENT AMONG AGES 55 TO 59 YEARS
99.8/ 100
METRIC RATING
40th/ 347
METRIC RANK
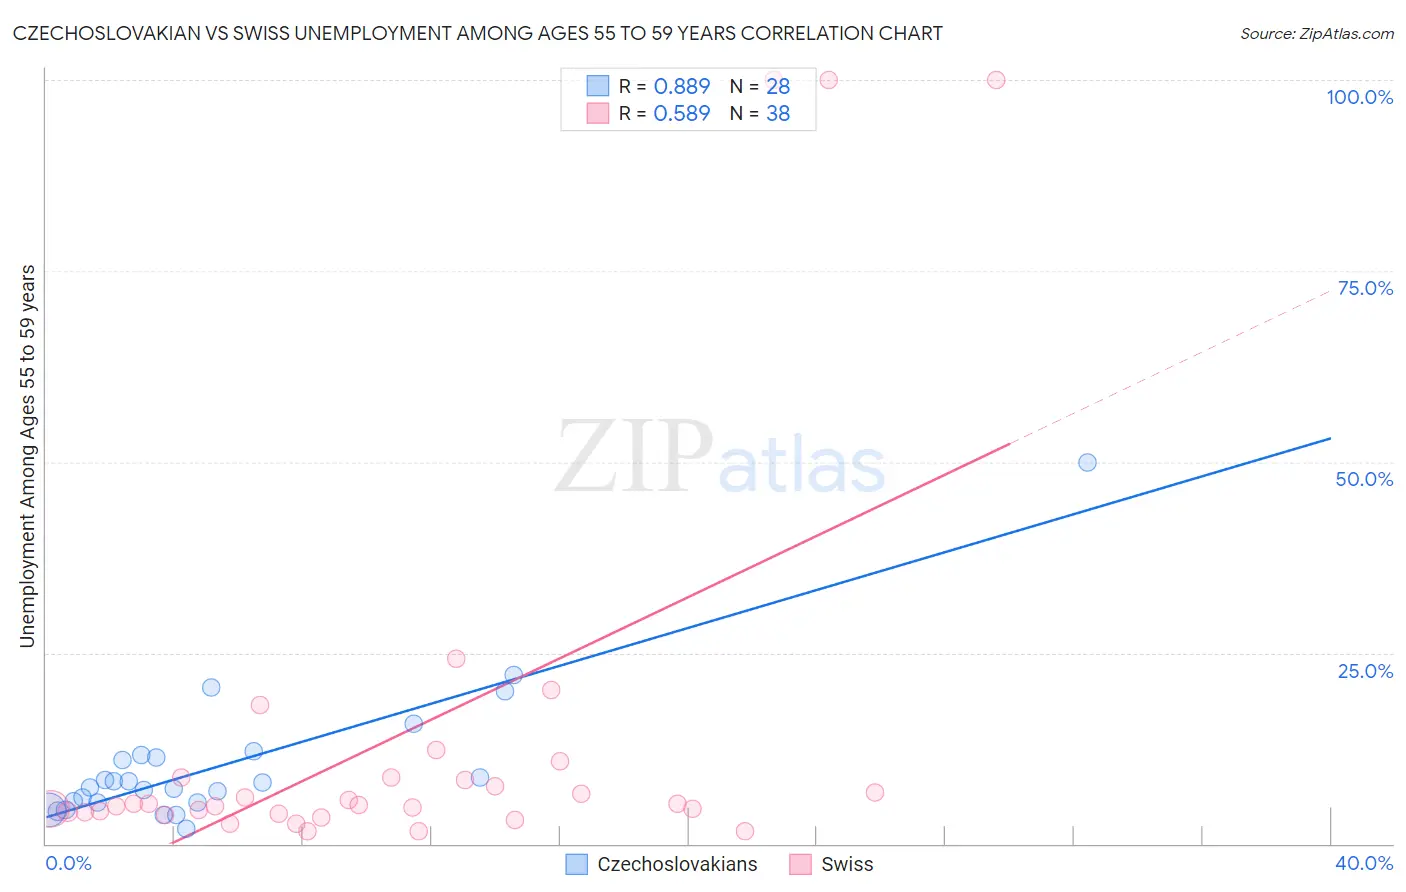
Czechoslovakian vs Swiss Unemployment Among Ages 55 to 59 years Correlation Chart
The statistical analysis conducted on geographies consisting of 340,490,837 people shows a very strong positive correlation between the proportion of Czechoslovakians and unemployment rate among population between the ages 55 and 59 in the United States with a correlation coefficient (R) of 0.889 and weighted average of 4.6%. Similarly, the statistical analysis conducted on geographies consisting of 414,857,786 people shows a substantial positive correlation between the proportion of Swiss and unemployment rate among population between the ages 55 and 59 in the United States with a correlation coefficient (R) of 0.589 and weighted average of 4.5%, a difference of 1.9%.
Unemployment Among Ages 55 to 59 years Correlation Summary
| Measurement | Czechoslovakian | Swiss |
| Minimum | 2.0% | 1.6% |
| Maximum | 50.0% | 100.0% |
| Range | 48.0% | 98.4% |
| Mean | 10.3% | 13.9% |
| Median | 7.8% | 5.1% |
| Interquartile 25% (IQ1) | 5.4% | 4.1% |
| Interquartile 75% (IQ3) | 11.5% | 8.7% |
| Interquartile Range (IQR) | 6.1% | 4.7% |
| Standard Deviation (Sample) | 9.3% | 26.0% |
| Standard Deviation (Population) | 9.2% | 25.7% |
Similar Demographics by Unemployment Among Ages 55 to 59 years
Demographics Similar to Czechoslovakians by Unemployment Among Ages 55 to 59 years
In terms of unemployment among ages 55 to 59 years, the demographic groups most similar to Czechoslovakians are Immigrants from Micronesia (4.6%, a difference of 0.010%), Ugandan (4.6%, a difference of 0.020%), Mongolian (4.6%, a difference of 0.060%), Sudanese (4.6%, a difference of 0.19%), and Argentinean (4.6%, a difference of 0.20%).
| Demographics | Rating | Rank | Unemployment Among Ages 55 to 59 years |
| Slovenes | 99.3 /100 | #62 | Exceptional 4.6% |
| Immigrants | South Central Asia | 99.3 /100 | #63 | Exceptional 4.6% |
| Argentineans | 99.1 /100 | #64 | Exceptional 4.6% |
| Sudanese | 99.1 /100 | #65 | Exceptional 4.6% |
| Mongolians | 99.0 /100 | #66 | Exceptional 4.6% |
| Ugandans | 99.0 /100 | #67 | Exceptional 4.6% |
| Immigrants | Micronesia | 99.0 /100 | #68 | Exceptional 4.6% |
| Czechoslovakians | 99.0 /100 | #69 | Exceptional 4.6% |
| Filipinos | 98.8 /100 | #70 | Exceptional 4.6% |
| Immigrants | Jordan | 98.7 /100 | #71 | Exceptional 4.6% |
| Immigrants | Taiwan | 98.7 /100 | #72 | Exceptional 4.6% |
| Bhutanese | 98.6 /100 | #73 | Exceptional 4.6% |
| Croatians | 98.5 /100 | #74 | Exceptional 4.6% |
| Immigrants | Iraq | 98.5 /100 | #75 | Exceptional 4.6% |
| Immigrants | Bosnia and Herzegovina | 98.3 /100 | #76 | Exceptional 4.6% |
Demographics Similar to Swiss by Unemployment Among Ages 55 to 59 years
In terms of unemployment among ages 55 to 59 years, the demographic groups most similar to Swiss are Luxembourger (4.5%, a difference of 0.010%), Immigrants from Kuwait (4.5%, a difference of 0.040%), Immigrants from Korea (4.5%, a difference of 0.070%), European (4.5%, a difference of 0.080%), and British (4.5%, a difference of 0.15%).
| Demographics | Rating | Rank | Unemployment Among Ages 55 to 59 years |
| Belgians | 99.9 /100 | #33 | Exceptional 4.5% |
| Thais | 99.9 /100 | #34 | Exceptional 4.5% |
| Cypriots | 99.9 /100 | #35 | Exceptional 4.5% |
| Ethiopians | 99.9 /100 | #36 | Exceptional 4.5% |
| Immigrants | Bulgaria | 99.9 /100 | #37 | Exceptional 4.5% |
| Assyrians/Chaldeans/Syriacs | 99.9 /100 | #38 | Exceptional 4.5% |
| English | 99.9 /100 | #39 | Exceptional 4.5% |
| Swiss | 99.8 /100 | #40 | Exceptional 4.5% |
| Luxembourgers | 99.8 /100 | #41 | Exceptional 4.5% |
| Immigrants | Kuwait | 99.8 /100 | #42 | Exceptional 4.5% |
| Immigrants | Korea | 99.8 /100 | #43 | Exceptional 4.5% |
| Europeans | 99.8 /100 | #44 | Exceptional 4.5% |
| British | 99.8 /100 | #45 | Exceptional 4.5% |
| Immigrants | Zaire | 99.8 /100 | #46 | Exceptional 4.5% |
| German Russians | 99.8 /100 | #47 | Exceptional 4.5% |