Czechoslovakian vs Immigrants from Spain Unemployment Among Ages 35 to 44 years
COMPARE
Czechoslovakian
Immigrants from Spain
Unemployment Among Ages 35 to 44 years
Unemployment Among Ages 35 to 44 years Comparison
Czechoslovakians
Immigrants from Spain
4.6%
UNEMPLOYMENT AMONG AGES 35 TO 44 YEARS
83.4/ 100
METRIC RATING
128th/ 347
METRIC RANK
4.5%
UNEMPLOYMENT AMONG AGES 35 TO 44 YEARS
86.1/ 100
METRIC RATING
124th/ 347
METRIC RANK
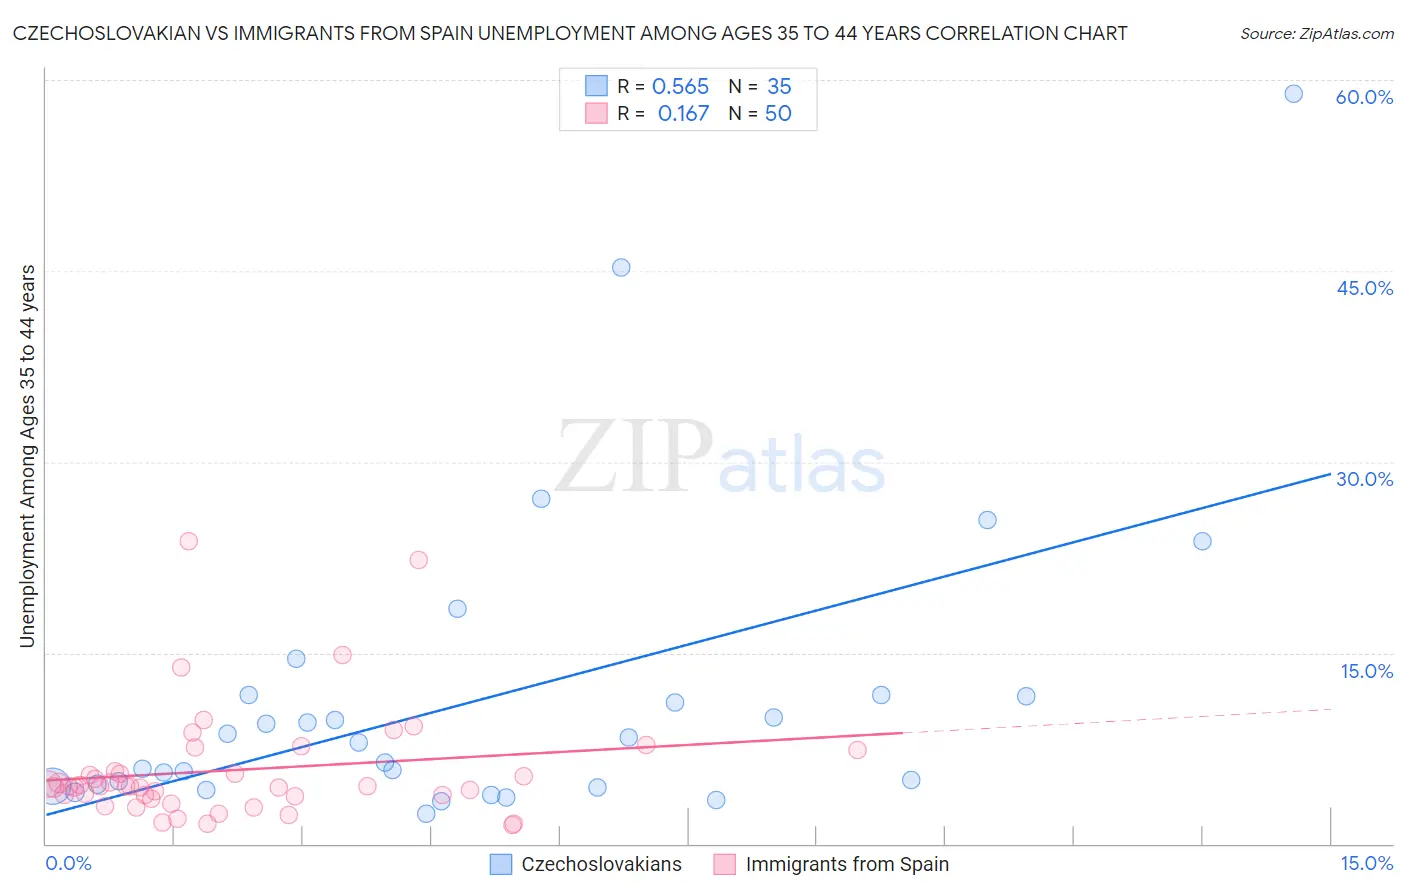
Czechoslovakian vs Immigrants from Spain Unemployment Among Ages 35 to 44 years Correlation Chart
The statistical analysis conducted on geographies consisting of 358,099,103 people shows a substantial positive correlation between the proportion of Czechoslovakians and unemployment rate among population between the ages 35 and 44 in the United States with a correlation coefficient (R) of 0.565 and weighted average of 4.6%. Similarly, the statistical analysis conducted on geographies consisting of 236,800,057 people shows a poor positive correlation between the proportion of Immigrants from Spain and unemployment rate among population between the ages 35 and 44 in the United States with a correlation coefficient (R) of 0.167 and weighted average of 4.5%, a difference of 0.38%.
Unemployment Among Ages 35 to 44 years Correlation Summary
| Measurement | Czechoslovakian | Immigrants from Spain |
| Minimum | 2.3% | 1.5% |
| Maximum | 59.0% | 23.8% |
| Range | 56.6% | 22.3% |
| Mean | 11.4% | 5.8% |
| Median | 8.0% | 4.5% |
| Interquartile 25% (IQ1) | 4.5% | 3.7% |
| Interquartile 75% (IQ3) | 11.6% | 5.7% |
| Interquartile Range (IQR) | 7.2% | 2.0% |
| Standard Deviation (Sample) | 12.0% | 4.5% |
| Standard Deviation (Population) | 11.9% | 4.5% |
Demographics Similar to Czechoslovakians and Immigrants from Spain by Unemployment Among Ages 35 to 44 years
In terms of unemployment among ages 35 to 44 years, the demographic groups most similar to Czechoslovakians are Immigrants from Croatia (4.6%, a difference of 0.040%), Immigrants from Eritrea (4.6%, a difference of 0.080%), Immigrants from Colombia (4.6%, a difference of 0.10%), Immigrants from Ethiopia (4.5%, a difference of 0.17%), and Immigrants from Austria (4.5%, a difference of 0.18%). Similarly, the demographic groups most similar to Immigrants from Spain are Immigrants from Northern Africa (4.5%, a difference of 0.0%), Basque (4.5%, a difference of 0.030%), Sri Lankan (4.5%, a difference of 0.11%), Immigrants from South Africa (4.5%, a difference of 0.12%), and Ethiopian (4.5%, a difference of 0.16%).
| Demographics | Rating | Rank | Unemployment Among Ages 35 to 44 years |
| Immigrants | Israel | 88.1 /100 | #116 | Excellent 4.5% |
| Immigrants | Greece | 87.9 /100 | #117 | Excellent 4.5% |
| Irish | 87.9 /100 | #118 | Excellent 4.5% |
| Nicaraguans | 87.6 /100 | #119 | Excellent 4.5% |
| Ethiopians | 87.1 /100 | #120 | Excellent 4.5% |
| Immigrants | South Africa | 86.8 /100 | #121 | Excellent 4.5% |
| Sri Lankans | 86.8 /100 | #122 | Excellent 4.5% |
| Basques | 86.3 /100 | #123 | Excellent 4.5% |
| Immigrants | Spain | 86.1 /100 | #124 | Excellent 4.5% |
| Immigrants | Northern Africa | 86.1 /100 | #125 | Excellent 4.5% |
| Immigrants | Austria | 84.7 /100 | #126 | Excellent 4.5% |
| Immigrants | Ethiopia | 84.7 /100 | #127 | Excellent 4.5% |
| Czechoslovakians | 83.4 /100 | #128 | Excellent 4.6% |
| Immigrants | Croatia | 83.1 /100 | #129 | Excellent 4.6% |
| Immigrants | Eritrea | 82.8 /100 | #130 | Excellent 4.6% |
| Immigrants | Colombia | 82.6 /100 | #131 | Excellent 4.6% |
| Colombians | 80.8 /100 | #132 | Excellent 4.6% |
| Syrians | 80.7 /100 | #133 | Excellent 4.6% |
| Laotians | 80.1 /100 | #134 | Excellent 4.6% |
| Immigrants | Europe | 79.4 /100 | #135 | Good 4.6% |
| Scotch-Irish | 79.3 /100 | #136 | Good 4.6% |