Czechoslovakian vs Immigrants from South Central Asia Unemployment Among Ages 65 to 74 years
COMPARE
Czechoslovakian
Immigrants from South Central Asia
Unemployment Among Ages 65 to 74 years
Unemployment Among Ages 65 to 74 years Comparison
Czechoslovakians
Immigrants from South Central Asia
5.3%
UNEMPLOYMENT AMONG AGES 65 TO 74 YEARS
88.6/ 100
METRIC RATING
123rd/ 347
METRIC RANK
5.3%
UNEMPLOYMENT AMONG AGES 65 TO 74 YEARS
92.4/ 100
METRIC RATING
112th/ 347
METRIC RANK
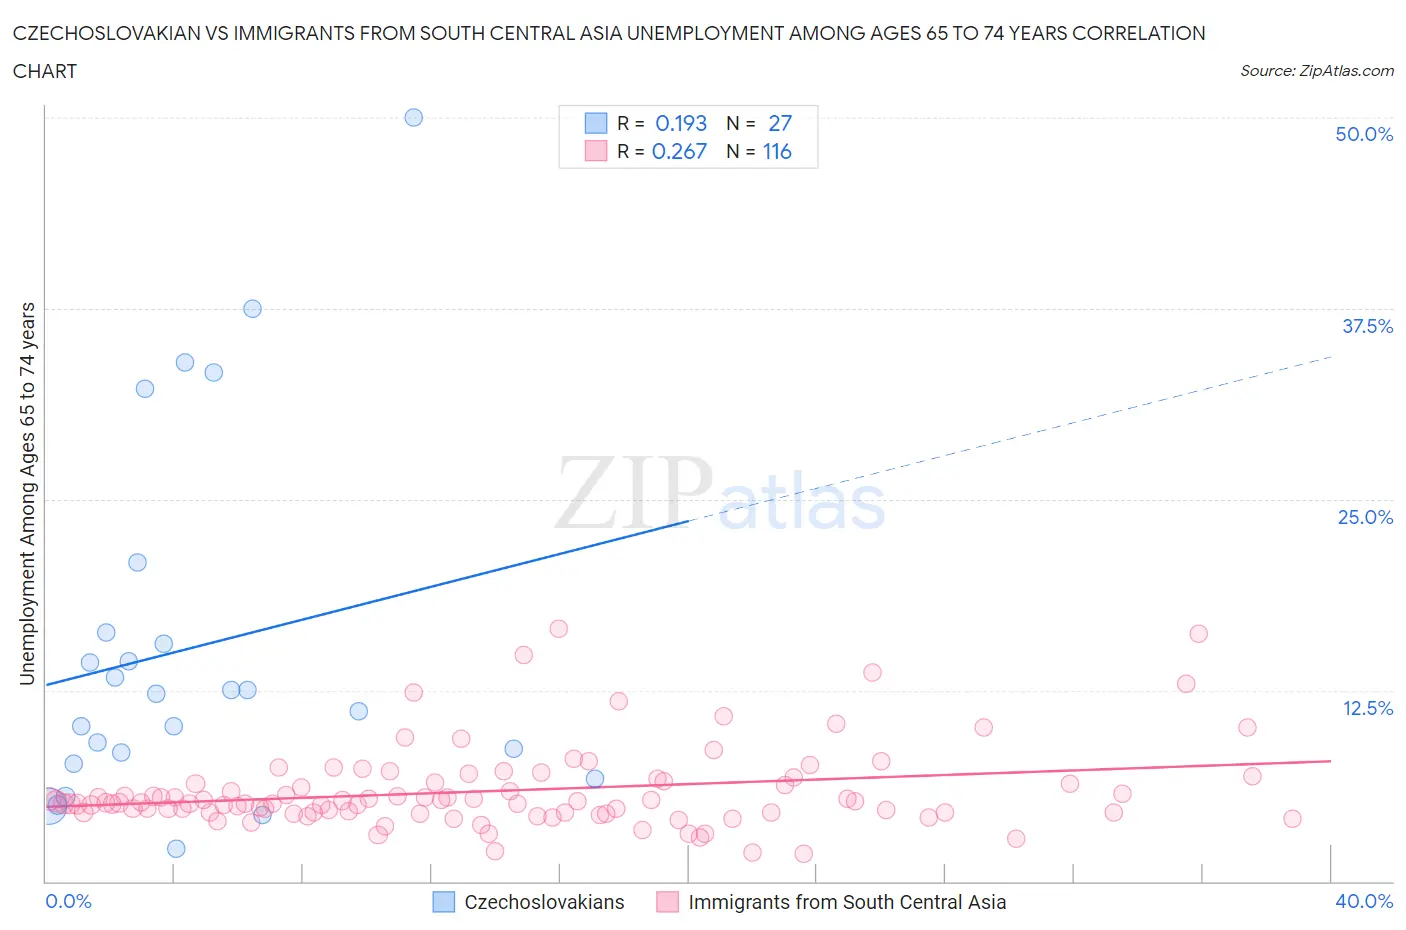
Czechoslovakian vs Immigrants from South Central Asia Unemployment Among Ages 65 to 74 years Correlation Chart
The statistical analysis conducted on geographies consisting of 320,601,940 people shows a poor positive correlation between the proportion of Czechoslovakians and unemployment rate among population between the ages 65 and 74 in the United States with a correlation coefficient (R) of 0.193 and weighted average of 5.3%. Similarly, the statistical analysis conducted on geographies consisting of 404,148,963 people shows a weak positive correlation between the proportion of Immigrants from South Central Asia and unemployment rate among population between the ages 65 and 74 in the United States with a correlation coefficient (R) of 0.267 and weighted average of 5.3%, a difference of 0.37%.
Unemployment Among Ages 65 to 74 years Correlation Summary
| Measurement | Czechoslovakian | Immigrants from South Central Asia |
| Minimum | 2.1% | 1.8% |
| Maximum | 50.0% | 16.6% |
| Range | 47.9% | 14.8% |
| Mean | 15.3% | 5.9% |
| Median | 12.3% | 5.2% |
| Interquartile 25% (IQ1) | 7.7% | 4.5% |
| Interquartile 75% (IQ3) | 16.3% | 6.5% |
| Interquartile Range (IQR) | 8.6% | 2.0% |
| Standard Deviation (Sample) | 11.9% | 2.7% |
| Standard Deviation (Population) | 11.6% | 2.7% |
Demographics Similar to Czechoslovakians and Immigrants from South Central Asia by Unemployment Among Ages 65 to 74 years
In terms of unemployment among ages 65 to 74 years, the demographic groups most similar to Czechoslovakians are Immigrants from Australia (5.3%, a difference of 0.040%), Immigrants from Canada (5.3%, a difference of 0.040%), Immigrants from Ukraine (5.3%, a difference of 0.090%), Pakistani (5.3%, a difference of 0.090%), and Immigrants from Fiji (5.3%, a difference of 0.12%). Similarly, the demographic groups most similar to Immigrants from South Central Asia are Sri Lankan (5.3%, a difference of 0.040%), Immigrants from Germany (5.3%, a difference of 0.090%), Asian (5.3%, a difference of 0.14%), Immigrants from Bolivia (5.2%, a difference of 0.16%), and Immigrants from Turkey (5.3%, a difference of 0.17%).
| Demographics | Rating | Rank | Unemployment Among Ages 65 to 74 years |
| Austrians | 94.5 /100 | #107 | Exceptional 5.2% |
| Immigrants | Malaysia | 94.1 /100 | #108 | Exceptional 5.2% |
| Immigrants | Singapore | 93.9 /100 | #109 | Exceptional 5.2% |
| Immigrants | Bolivia | 93.6 /100 | #110 | Exceptional 5.2% |
| Sri Lankans | 92.7 /100 | #111 | Exceptional 5.3% |
| Immigrants | South Central Asia | 92.4 /100 | #112 | Exceptional 5.3% |
| Immigrants | Germany | 91.6 /100 | #113 | Exceptional 5.3% |
| Asians | 91.1 /100 | #114 | Exceptional 5.3% |
| Immigrants | Turkey | 90.8 /100 | #115 | Exceptional 5.3% |
| Australians | 90.4 /100 | #116 | Exceptional 5.3% |
| Immigrants | Korea | 90.2 /100 | #117 | Exceptional 5.3% |
| Immigrants | Belarus | 90.1 /100 | #118 | Exceptional 5.3% |
| Immigrants | Fiji | 89.9 /100 | #119 | Excellent 5.3% |
| Immigrants | Switzerland | 89.9 /100 | #120 | Excellent 5.3% |
| Immigrants | Australia | 89.1 /100 | #121 | Excellent 5.3% |
| Immigrants | Canada | 89.0 /100 | #122 | Excellent 5.3% |
| Czechoslovakians | 88.6 /100 | #123 | Excellent 5.3% |
| Immigrants | Ukraine | 87.5 /100 | #124 | Excellent 5.3% |
| Pakistanis | 87.5 /100 | #125 | Excellent 5.3% |
| Immigrants | South Eastern Asia | 87.2 /100 | #126 | Excellent 5.3% |
| Immigrants | North America | 86.7 /100 | #127 | Excellent 5.3% |