Cypriot vs Iraqi Unemployment Among Ages 25 to 29 years
COMPARE
Cypriot
Iraqi
Unemployment Among Ages 25 to 29 years
Unemployment Among Ages 25 to 29 years Comparison
Cypriots
Iraqis
6.4%
UNEMPLOYMENT AMONG AGES 25 TO 29 YEARS
90.1/ 100
METRIC RATING
104th/ 347
METRIC RANK
6.4%
UNEMPLOYMENT AMONG AGES 25 TO 29 YEARS
91.3/ 100
METRIC RATING
99th/ 347
METRIC RANK
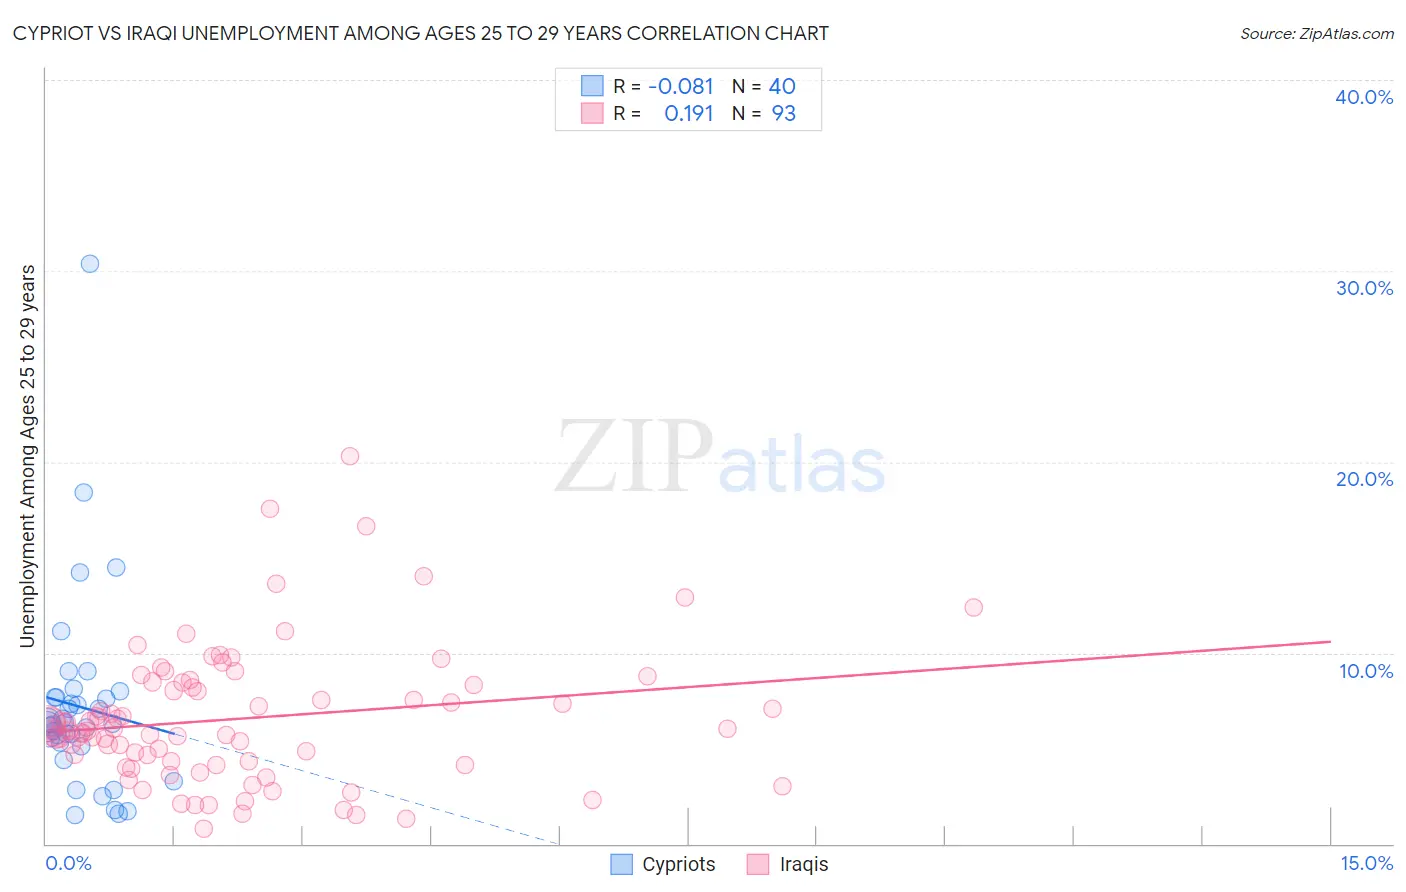
Cypriot vs Iraqi Unemployment Among Ages 25 to 29 years Correlation Chart
The statistical analysis conducted on geographies consisting of 61,052,592 people shows a slight negative correlation between the proportion of Cypriots and unemployment rate among population between the ages 25 and 29 in the United States with a correlation coefficient (R) of -0.081 and weighted average of 6.4%. Similarly, the statistical analysis conducted on geographies consisting of 167,795,062 people shows a poor positive correlation between the proportion of Iraqis and unemployment rate among population between the ages 25 and 29 in the United States with a correlation coefficient (R) of 0.191 and weighted average of 6.4%, a difference of 0.24%.
Unemployment Among Ages 25 to 29 years Correlation Summary
| Measurement | Cypriot | Iraqi |
| Minimum | 1.5% | 0.80% |
| Maximum | 30.4% | 20.3% |
| Range | 28.9% | 19.5% |
| Mean | 7.2% | 6.6% |
| Median | 6.3% | 5.9% |
| Interquartile 25% (IQ1) | 5.2% | 4.2% |
| Interquartile 75% (IQ3) | 7.7% | 8.4% |
| Interquartile Range (IQR) | 2.5% | 4.2% |
| Standard Deviation (Sample) | 5.1% | 3.5% |
| Standard Deviation (Population) | 5.1% | 3.5% |
Demographics Similar to Cypriots and Iraqis by Unemployment Among Ages 25 to 29 years
In terms of unemployment among ages 25 to 29 years, the demographic groups most similar to Cypriots are Immigrants from Kazakhstan (6.4%, a difference of 0.040%), Immigrants from Congo (6.4%, a difference of 0.060%), British (6.4%, a difference of 0.080%), Immigrants from Hungary (6.4%, a difference of 0.11%), and Immigrants from Ireland (6.4%, a difference of 0.20%). Similarly, the demographic groups most similar to Iraqis are Uruguayan (6.4%, a difference of 0.030%), Immigrants from Ireland (6.4%, a difference of 0.040%), Serbian (6.4%, a difference of 0.090%), Immigrants from Eastern Europe (6.4%, a difference of 0.11%), and British (6.4%, a difference of 0.16%).
| Demographics | Rating | Rank | Unemployment Among Ages 25 to 29 years |
| Egyptians | 93.9 /100 | #91 | Exceptional 6.4% |
| Immigrants | North Macedonia | 93.6 /100 | #92 | Exceptional 6.4% |
| Australians | 93.6 /100 | #93 | Exceptional 6.4% |
| Zimbabweans | 93.5 /100 | #94 | Exceptional 6.4% |
| Afghans | 92.5 /100 | #95 | Exceptional 6.4% |
| Immigrants | Brazil | 92.1 /100 | #96 | Exceptional 6.4% |
| Immigrants | Eastern Europe | 91.9 /100 | #97 | Exceptional 6.4% |
| Serbians | 91.7 /100 | #98 | Exceptional 6.4% |
| Iraqis | 91.3 /100 | #99 | Exceptional 6.4% |
| Uruguayans | 91.2 /100 | #100 | Exceptional 6.4% |
| Immigrants | Ireland | 91.1 /100 | #101 | Exceptional 6.4% |
| British | 90.5 /100 | #102 | Exceptional 6.4% |
| Immigrants | Congo | 90.4 /100 | #103 | Exceptional 6.4% |
| Cypriots | 90.1 /100 | #104 | Exceptional 6.4% |
| Immigrants | Kazakhstan | 89.8 /100 | #105 | Excellent 6.4% |
| Immigrants | Hungary | 89.4 /100 | #106 | Excellent 6.4% |
| Swiss | 88.6 /100 | #107 | Excellent 6.4% |
| Croatians | 88.2 /100 | #108 | Excellent 6.4% |
| Immigrants | Albania | 87.9 /100 | #109 | Excellent 6.4% |
| Europeans | 87.8 /100 | #110 | Excellent 6.4% |
| Immigrants | Colombia | 87.6 /100 | #111 | Excellent 6.4% |