Cypriot vs Iranian Unemployment Among Ages 20 to 24 years
COMPARE
Cypriot
Iranian
Unemployment Among Ages 20 to 24 years
Unemployment Among Ages 20 to 24 years Comparison
Cypriots
Iranians
10.4%
UNEMPLOYMENT AMONG AGES 20 TO 24 YEARS
18.9/ 100
METRIC RATING
205th/ 347
METRIC RANK
10.2%
UNEMPLOYMENT AMONG AGES 20 TO 24 YEARS
72.4/ 100
METRIC RATING
152nd/ 347
METRIC RANK
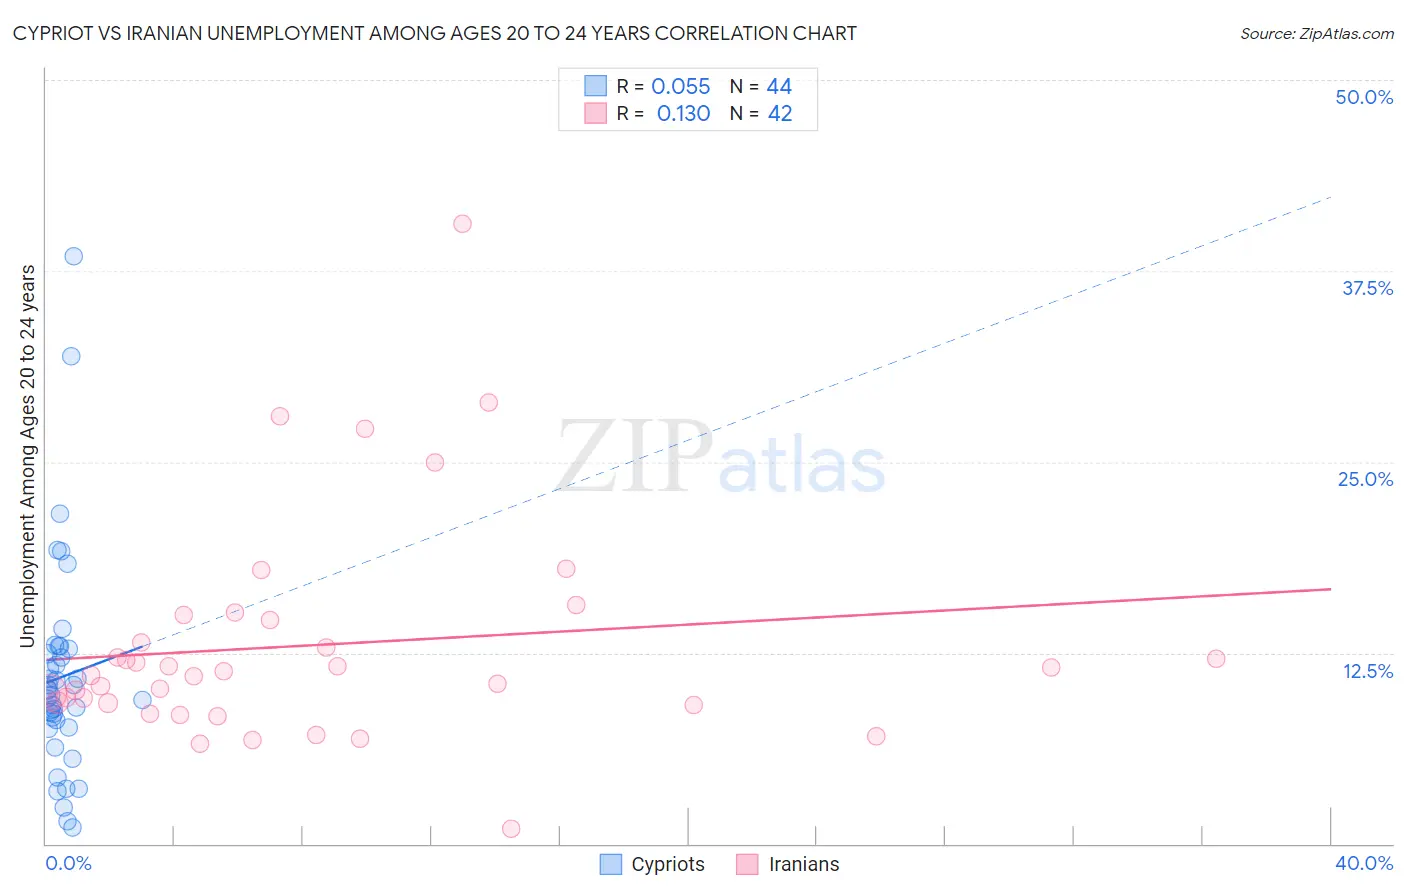
Cypriot vs Iranian Unemployment Among Ages 20 to 24 years Correlation Chart
The statistical analysis conducted on geographies consisting of 61,203,816 people shows a slight positive correlation between the proportion of Cypriots and unemployment rate among population between the ages 20 and 24 in the United States with a correlation coefficient (R) of 0.055 and weighted average of 10.4%. Similarly, the statistical analysis conducted on geographies consisting of 310,673,283 people shows a poor positive correlation between the proportion of Iranians and unemployment rate among population between the ages 20 and 24 in the United States with a correlation coefficient (R) of 0.130 and weighted average of 10.2%, a difference of 2.2%.
Unemployment Among Ages 20 to 24 years Correlation Summary
| Measurement | Cypriot | Iranian |
| Minimum | 1.1% | 1.0% |
| Maximum | 38.5% | 40.6% |
| Range | 37.4% | 39.6% |
| Mean | 10.9% | 13.0% |
| Median | 9.9% | 11.2% |
| Interquartile 25% (IQ1) | 7.9% | 9.2% |
| Interquartile 75% (IQ3) | 12.6% | 14.6% |
| Interquartile Range (IQR) | 4.8% | 5.4% |
| Standard Deviation (Sample) | 7.0% | 7.3% |
| Standard Deviation (Population) | 6.9% | 7.2% |
Similar Demographics by Unemployment Among Ages 20 to 24 years
Demographics Similar to Cypriots by Unemployment Among Ages 20 to 24 years
In terms of unemployment among ages 20 to 24 years, the demographic groups most similar to Cypriots are Immigrants from Europe (10.4%, a difference of 0.030%), Immigrants from Northern Europe (10.4%, a difference of 0.040%), Immigrants from Honduras (10.4%, a difference of 0.060%), Immigrants from Hong Kong (10.5%, a difference of 0.080%), and South American (10.4%, a difference of 0.090%).
| Demographics | Rating | Rank | Unemployment Among Ages 20 to 24 years |
| Colombians | 22.3 /100 | #198 | Fair 10.4% |
| Portuguese | 21.8 /100 | #199 | Fair 10.4% |
| Russians | 21.2 /100 | #200 | Fair 10.4% |
| Immigrants | Peru | 21.2 /100 | #201 | Fair 10.4% |
| Immigrants | Middle Africa | 20.9 /100 | #202 | Fair 10.4% |
| South Americans | 20.6 /100 | #203 | Fair 10.4% |
| Immigrants | Northern Europe | 19.5 /100 | #204 | Poor 10.4% |
| Cypriots | 18.9 /100 | #205 | Poor 10.4% |
| Immigrants | Europe | 18.5 /100 | #206 | Poor 10.4% |
| Immigrants | Honduras | 17.9 /100 | #207 | Poor 10.4% |
| Immigrants | Hong Kong | 17.6 /100 | #208 | Poor 10.5% |
| Peruvians | 17.2 /100 | #209 | Poor 10.5% |
| Immigrants | Belgium | 16.9 /100 | #210 | Poor 10.5% |
| Immigrants | Guatemala | 14.6 /100 | #211 | Poor 10.5% |
| Immigrants | Sri Lanka | 14.0 /100 | #212 | Poor 10.5% |
Demographics Similar to Iranians by Unemployment Among Ages 20 to 24 years
In terms of unemployment among ages 20 to 24 years, the demographic groups most similar to Iranians are Immigrants from Taiwan (10.2%, a difference of 0.040%), Immigrants from Switzerland (10.2%, a difference of 0.050%), Immigrants from South Africa (10.2%, a difference of 0.060%), Immigrants from Scotland (10.2%, a difference of 0.10%), and Hungarian (10.2%, a difference of 0.10%).
| Demographics | Rating | Rank | Unemployment Among Ages 20 to 24 years |
| Argentineans | 78.0 /100 | #145 | Good 10.2% |
| Asians | 77.7 /100 | #146 | Good 10.2% |
| French Canadians | 77.5 /100 | #147 | Good 10.2% |
| Immigrants | Romania | 75.7 /100 | #148 | Good 10.2% |
| Immigrants | Scotland | 74.6 /100 | #149 | Good 10.2% |
| Hungarians | 74.4 /100 | #150 | Good 10.2% |
| Immigrants | South Africa | 73.6 /100 | #151 | Good 10.2% |
| Iranians | 72.4 /100 | #152 | Good 10.2% |
| Immigrants | Taiwan | 71.4 /100 | #153 | Good 10.2% |
| Immigrants | Switzerland | 71.3 /100 | #154 | Good 10.2% |
| Lithuanians | 70.0 /100 | #155 | Good 10.2% |
| Canadians | 66.7 /100 | #156 | Good 10.2% |
| Immigrants | Uganda | 65.6 /100 | #157 | Good 10.2% |
| Immigrants | Kazakhstan | 65.5 /100 | #158 | Good 10.2% |
| Immigrants | England | 63.7 /100 | #159 | Good 10.3% |