Cypriot vs Immigrants from Austria Unemployment Among Ages 45 to 54 years
COMPARE
Cypriot
Immigrants from Austria
Unemployment Among Ages 45 to 54 years
Unemployment Among Ages 45 to 54 years Comparison
Cypriots
Immigrants from Austria
4.5%
UNEMPLOYMENT AMONG AGES 45 TO 54 YEARS
74.4/ 100
METRIC RATING
151st/ 347
METRIC RANK
4.5%
UNEMPLOYMENT AMONG AGES 45 TO 54 YEARS
75.3/ 100
METRIC RATING
148th/ 347
METRIC RANK
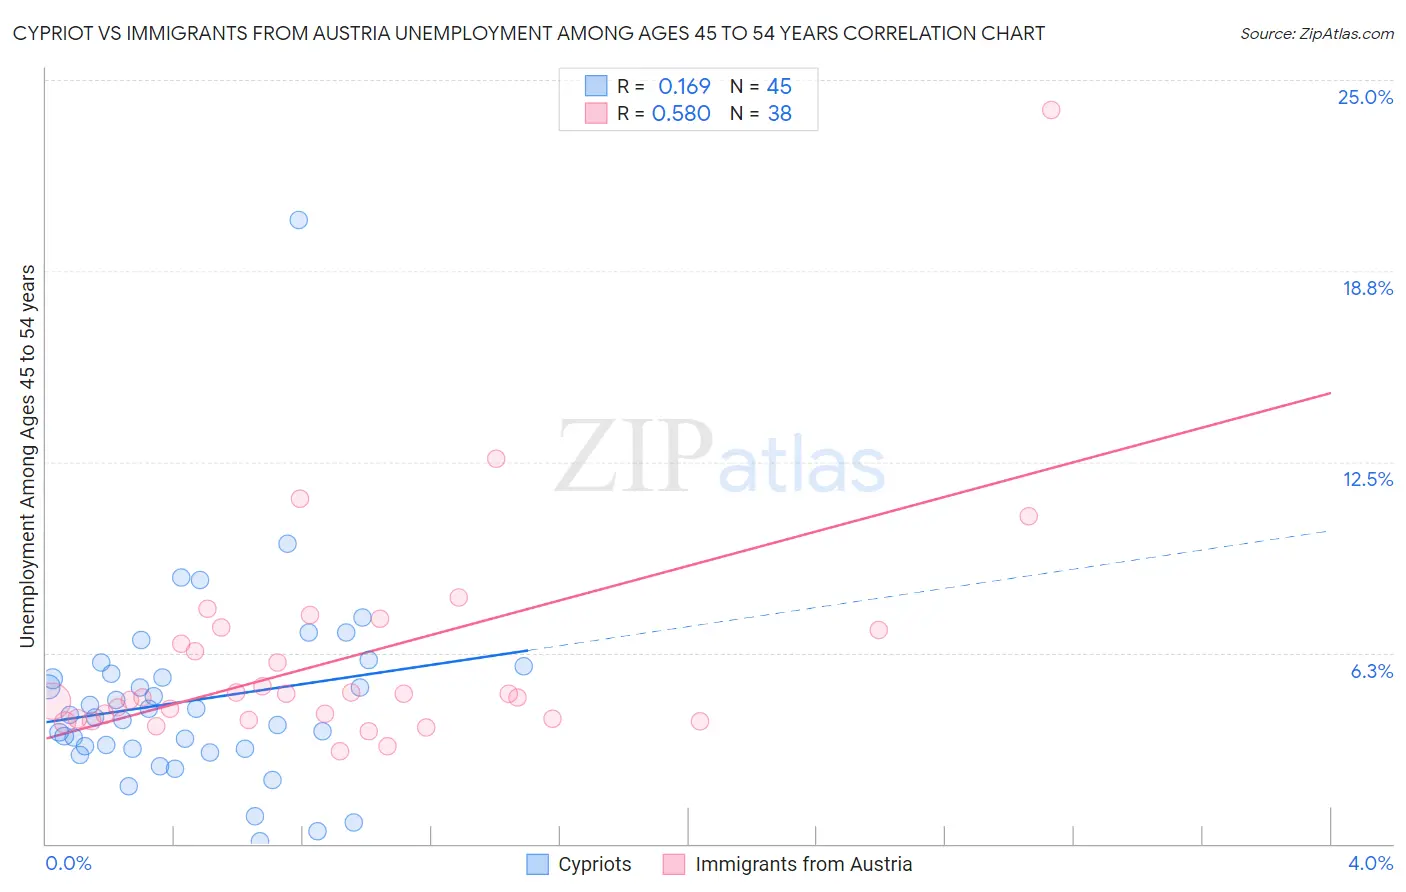
Cypriot vs Immigrants from Austria Unemployment Among Ages 45 to 54 years Correlation Chart
The statistical analysis conducted on geographies consisting of 61,639,842 people shows a poor positive correlation between the proportion of Cypriots and unemployment rate among population between the ages 45 and 54 in the United States with a correlation coefficient (R) of 0.169 and weighted average of 4.5%. Similarly, the statistical analysis conducted on geographies consisting of 165,784,372 people shows a substantial positive correlation between the proportion of Immigrants from Austria and unemployment rate among population between the ages 45 and 54 in the United States with a correlation coefficient (R) of 0.580 and weighted average of 4.5%, a difference of 0.060%.
Unemployment Among Ages 45 to 54 years Correlation Summary
| Measurement | Cypriot | Immigrants from Austria |
| Minimum | 0.10% | 3.0% |
| Maximum | 20.4% | 24.0% |
| Range | 20.3% | 21.0% |
| Mean | 4.7% | 6.1% |
| Median | 4.2% | 4.9% |
| Interquartile 25% (IQ1) | 3.1% | 4.1% |
| Interquartile 75% (IQ3) | 5.7% | 7.0% |
| Interquartile Range (IQR) | 2.6% | 2.9% |
| Standard Deviation (Sample) | 3.2% | 3.7% |
| Standard Deviation (Population) | 3.2% | 3.7% |
Demographics Similar to Cypriots and Immigrants from Austria by Unemployment Among Ages 45 to 54 years
In terms of unemployment among ages 45 to 54 years, the demographic groups most similar to Cypriots are Tsimshian (4.5%, a difference of 0.010%), Costa Rican (4.5%, a difference of 0.060%), Korean (4.5%, a difference of 0.080%), Hungarian (4.5%, a difference of 0.090%), and Immigrants from Spain (4.5%, a difference of 0.12%). Similarly, the demographic groups most similar to Immigrants from Austria are Costa Rican (4.5%, a difference of 0.0%), Tsimshian (4.5%, a difference of 0.040%), Uruguayan (4.5%, a difference of 0.10%), Syrian (4.5%, a difference of 0.13%), and Immigrants from Latvia (4.5%, a difference of 0.14%).
| Demographics | Rating | Rank | Unemployment Among Ages 45 to 54 years |
| Immigrants | Kuwait | 81.7 /100 | #139 | Excellent 4.4% |
| Immigrants | Zaire | 80.7 /100 | #140 | Excellent 4.4% |
| Immigrants | Afghanistan | 79.6 /100 | #141 | Good 4.4% |
| Immigrants | Netherlands | 79.4 /100 | #142 | Good 4.4% |
| Macedonians | 79.0 /100 | #143 | Good 4.5% |
| Taiwanese | 77.9 /100 | #144 | Good 4.5% |
| Immigrants | Latvia | 77.5 /100 | #145 | Good 4.5% |
| Syrians | 77.3 /100 | #146 | Good 4.5% |
| Uruguayans | 76.9 /100 | #147 | Good 4.5% |
| Immigrants | Austria | 75.3 /100 | #148 | Good 4.5% |
| Costa Ricans | 75.3 /100 | #149 | Good 4.5% |
| Tsimshian | 74.6 /100 | #150 | Good 4.5% |
| Cypriots | 74.4 /100 | #151 | Good 4.5% |
| Koreans | 73.1 /100 | #152 | Good 4.5% |
| Hungarians | 73.0 /100 | #153 | Good 4.5% |
| Immigrants | Spain | 72.5 /100 | #154 | Good 4.5% |
| Marshallese | 70.6 /100 | #155 | Good 4.5% |
| Immigrants | Croatia | 69.6 /100 | #156 | Good 4.5% |
| Indians (Asian) | 68.1 /100 | #157 | Good 4.5% |
| Immigrants | Italy | 65.5 /100 | #158 | Good 4.5% |
| Immigrants | Nonimmigrants | 62.8 /100 | #159 | Good 4.5% |