Cuban vs German Unemployment Among Seniors over 65 years
COMPARE
Cuban
German
Unemployment Among Seniors over 65 years
Unemployment Among Seniors over 65 years Comparison
Cubans
Germans
4.6%
UNEMPLOYMENT AMONG SENIORS OVER 65 YEARS
100.0/ 100
METRIC RATING
13th/ 347
METRIC RANK
4.9%
UNEMPLOYMENT AMONG SENIORS OVER 65 YEARS
99.9/ 100
METRIC RATING
47th/ 347
METRIC RANK
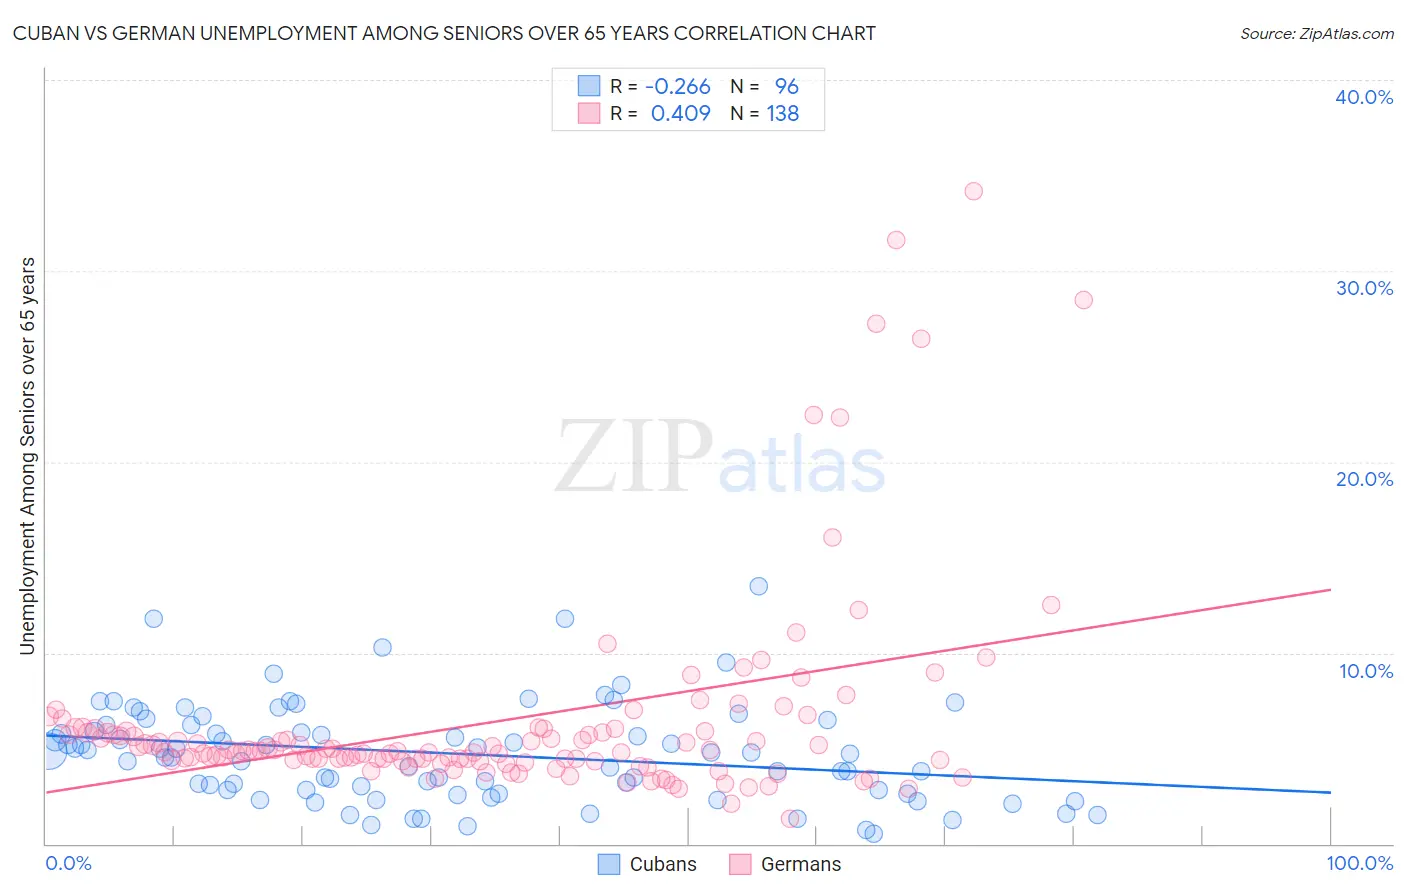
Cuban vs German Unemployment Among Seniors over 65 years Correlation Chart
The statistical analysis conducted on geographies consisting of 398,566,007 people shows a weak negative correlation between the proportion of Cubans and unemployment rate amomg seniors over the age of 65 in the United States with a correlation coefficient (R) of -0.266 and weighted average of 4.6%. Similarly, the statistical analysis conducted on geographies consisting of 464,259,353 people shows a moderate positive correlation between the proportion of Germans and unemployment rate amomg seniors over the age of 65 in the United States with a correlation coefficient (R) of 0.409 and weighted average of 4.9%, a difference of 5.5%.
Unemployment Among Seniors over 65 years Correlation Summary
| Measurement | Cuban | German |
| Minimum | 0.50% | 1.3% |
| Maximum | 13.5% | 34.2% |
| Range | 13.0% | 32.9% |
| Mean | 4.7% | 6.4% |
| Median | 4.8% | 4.9% |
| Interquartile 25% (IQ1) | 2.8% | 4.4% |
| Interquartile 75% (IQ3) | 6.2% | 5.9% |
| Interquartile Range (IQR) | 3.4% | 1.5% |
| Standard Deviation (Sample) | 2.6% | 5.4% |
| Standard Deviation (Population) | 2.6% | 5.4% |
Similar Demographics by Unemployment Among Seniors over 65 years
Demographics Similar to Cubans by Unemployment Among Seniors over 65 years
In terms of unemployment among seniors over 65 years, the demographic groups most similar to Cubans are Osage (4.6%, a difference of 0.10%), Menominee (4.6%, a difference of 0.44%), Lumbee (4.6%, a difference of 0.52%), Immigrants from Burma/Myanmar (4.6%, a difference of 0.52%), and Creek (4.6%, a difference of 0.63%).
| Demographics | Rating | Rank | Unemployment Among Seniors over 65 years |
| Immigrants | Cuba | 100.0 /100 | #6 | Exceptional 4.5% |
| Immigrants | Congo | 100.0 /100 | #7 | Exceptional 4.5% |
| Tsimshian | 100.0 /100 | #8 | Exceptional 4.5% |
| Indonesians | 100.0 /100 | #9 | Exceptional 4.5% |
| Immigrants | Zaire | 100.0 /100 | #10 | Exceptional 4.5% |
| Comanche | 100.0 /100 | #11 | Exceptional 4.6% |
| Osage | 100.0 /100 | #12 | Exceptional 4.6% |
| Cubans | 100.0 /100 | #13 | Exceptional 4.6% |
| Menominee | 100.0 /100 | #14 | Exceptional 4.6% |
| Lumbee | 100.0 /100 | #15 | Exceptional 4.6% |
| Immigrants | Burma/Myanmar | 100.0 /100 | #16 | Exceptional 4.6% |
| Creek | 100.0 /100 | #17 | Exceptional 4.6% |
| Immigrants | Eritrea | 100.0 /100 | #18 | Exceptional 4.7% |
| Lebanese | 100.0 /100 | #19 | Exceptional 4.7% |
| Immigrants | Nepal | 100.0 /100 | #20 | Exceptional 4.7% |
Demographics Similar to Germans by Unemployment Among Seniors over 65 years
In terms of unemployment among seniors over 65 years, the demographic groups most similar to Germans are Choctaw (4.9%, a difference of 0.010%), Immigrants from Jordan (4.9%, a difference of 0.030%), Ethiopian (4.9%, a difference of 0.16%), Jordanian (4.9%, a difference of 0.20%), and Immigrants from Kenya (4.9%, a difference of 0.20%).
| Demographics | Rating | Rank | Unemployment Among Seniors over 65 years |
| Immigrants | Sweden | 99.9 /100 | #40 | Exceptional 4.8% |
| Kiowa | 99.9 /100 | #41 | Exceptional 4.8% |
| Swiss | 99.9 /100 | #42 | Exceptional 4.8% |
| Luxembourgers | 99.9 /100 | #43 | Exceptional 4.8% |
| Jordanians | 99.9 /100 | #44 | Exceptional 4.9% |
| Ethiopians | 99.9 /100 | #45 | Exceptional 4.9% |
| Immigrants | Jordan | 99.9 /100 | #46 | Exceptional 4.9% |
| Germans | 99.9 /100 | #47 | Exceptional 4.9% |
| Choctaw | 99.9 /100 | #48 | Exceptional 4.9% |
| Immigrants | Kenya | 99.9 /100 | #49 | Exceptional 4.9% |
| Immigrants | Austria | 99.9 /100 | #50 | Exceptional 4.9% |
| Scotch-Irish | 99.9 /100 | #51 | Exceptional 4.9% |
| Swedes | 99.9 /100 | #52 | Exceptional 4.9% |
| Immigrants | Sudan | 99.8 /100 | #53 | Exceptional 4.9% |
| Immigrants | Iraq | 99.8 /100 | #54 | Exceptional 4.9% |