Croatian vs English Unemployment Among Ages 35 to 44 years
COMPARE
Croatian
English
Unemployment Among Ages 35 to 44 years
Unemployment Among Ages 35 to 44 years Comparison
Croatians
English
4.4%
UNEMPLOYMENT AMONG AGES 35 TO 44 YEARS
97.1/ 100
METRIC RATING
61st/ 347
METRIC RANK
4.4%
UNEMPLOYMENT AMONG AGES 35 TO 44 YEARS
97.2/ 100
METRIC RATING
58th/ 347
METRIC RANK
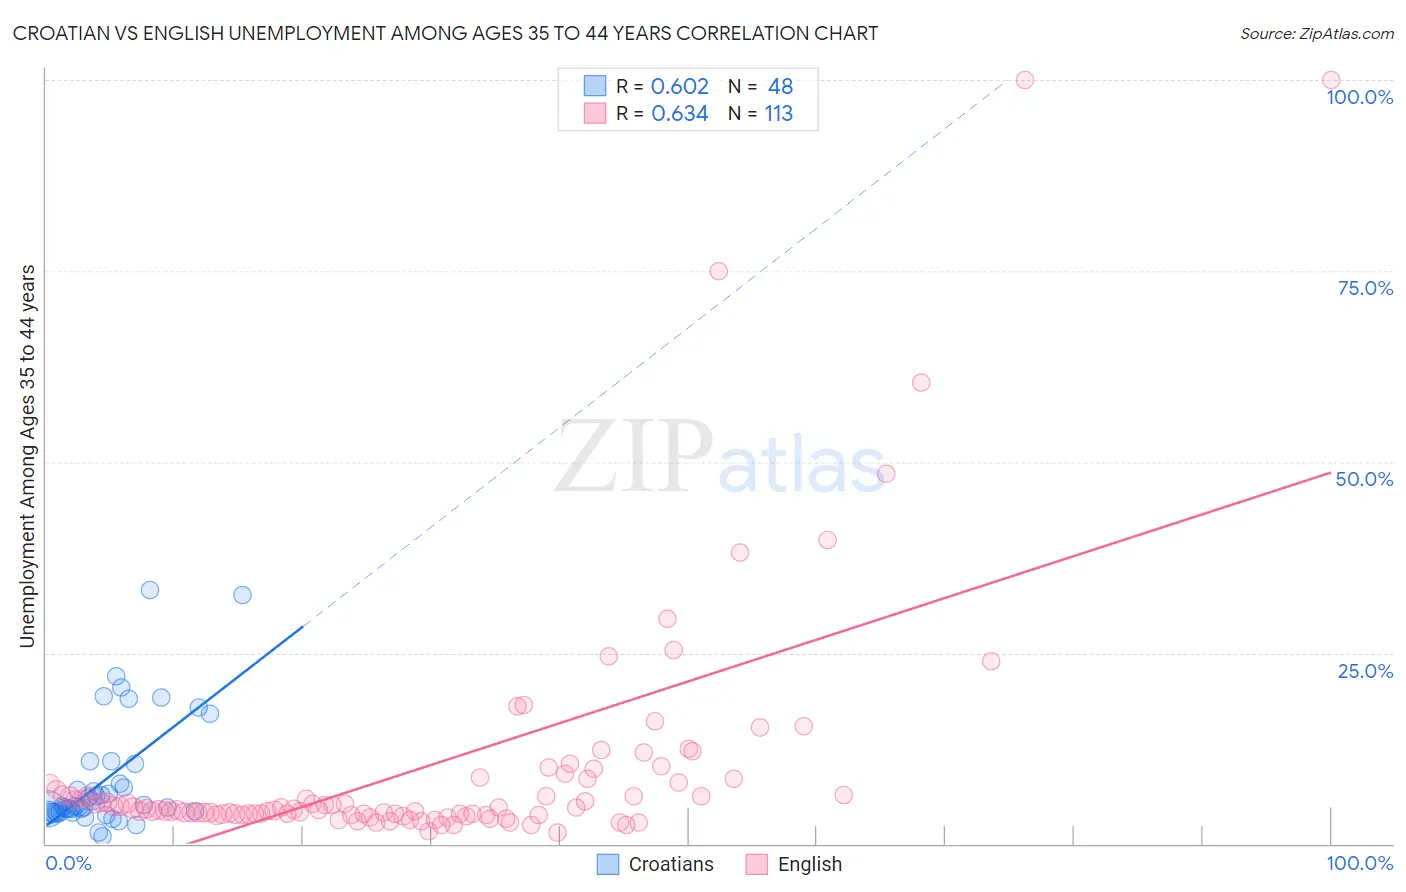
Croatian vs English Unemployment Among Ages 35 to 44 years Correlation Chart
The statistical analysis conducted on geographies consisting of 365,717,044 people shows a significant positive correlation between the proportion of Croatians and unemployment rate among population between the ages 35 and 44 in the United States with a correlation coefficient (R) of 0.602 and weighted average of 4.4%. Similarly, the statistical analysis conducted on geographies consisting of 536,116,961 people shows a significant positive correlation between the proportion of English and unemployment rate among population between the ages 35 and 44 in the United States with a correlation coefficient (R) of 0.634 and weighted average of 4.4%, a difference of 0.050%.
Unemployment Among Ages 35 to 44 years Correlation Summary
| Measurement | Croatian | English |
| Minimum | 0.98% | 1.4% |
| Maximum | 33.3% | 100.0% |
| Range | 32.3% | 98.6% |
| Mean | 8.3% | 10.1% |
| Median | 4.9% | 4.6% |
| Interquartile 25% (IQ1) | 4.2% | 3.9% |
| Interquartile 75% (IQ3) | 9.2% | 8.3% |
| Interquartile Range (IQR) | 5.0% | 4.4% |
| Standard Deviation (Sample) | 7.5% | 16.4% |
| Standard Deviation (Population) | 7.4% | 16.4% |
Demographics Similar to Croatians and English by Unemployment Among Ages 35 to 44 years
In terms of unemployment among ages 35 to 44 years, the demographic groups most similar to Croatians are Immigrants from Bulgaria (4.4%, a difference of 0.0%), Taiwanese (4.4%, a difference of 0.010%), Austrian (4.4%, a difference of 0.010%), Immigrants from Serbia (4.4%, a difference of 0.030%), and Greek (4.4%, a difference of 0.040%). Similarly, the demographic groups most similar to English are Greek (4.4%, a difference of 0.010%), Immigrants from Hong Kong (4.4%, a difference of 0.020%), Taiwanese (4.4%, a difference of 0.040%), Immigrants from Bulgaria (4.4%, a difference of 0.050%), and Austrian (4.4%, a difference of 0.060%).
| Demographics | Rating | Rank | Unemployment Among Ages 35 to 44 years |
| Swiss | 98.2 /100 | #49 | Exceptional 4.4% |
| Immigrants | Turkey | 97.8 /100 | #50 | Exceptional 4.4% |
| Immigrants | Eastern Asia | 97.8 /100 | #51 | Exceptional 4.4% |
| Okinawans | 97.7 /100 | #52 | Exceptional 4.4% |
| Immigrants | Argentina | 97.6 /100 | #53 | Exceptional 4.4% |
| Asians | 97.4 /100 | #54 | Exceptional 4.4% |
| Immigrants | Moldova | 97.3 /100 | #55 | Exceptional 4.4% |
| Chileans | 97.3 /100 | #56 | Exceptional 4.4% |
| Immigrants | Hong Kong | 97.2 /100 | #57 | Exceptional 4.4% |
| English | 97.2 /100 | #58 | Exceptional 4.4% |
| Greeks | 97.1 /100 | #59 | Exceptional 4.4% |
| Taiwanese | 97.1 /100 | #60 | Exceptional 4.4% |
| Croatians | 97.1 /100 | #61 | Exceptional 4.4% |
| Immigrants | Bulgaria | 97.1 /100 | #62 | Exceptional 4.4% |
| Austrians | 97.1 /100 | #63 | Exceptional 4.4% |
| Immigrants | Serbia | 97.0 /100 | #64 | Exceptional 4.4% |
| Cambodians | 97.0 /100 | #65 | Exceptional 4.4% |
| Icelanders | 96.8 /100 | #66 | Exceptional 4.4% |
| Argentineans | 96.8 /100 | #67 | Exceptional 4.4% |
| Immigrants | Ireland | 96.8 /100 | #68 | Exceptional 4.4% |
| Slovenes | 96.7 /100 | #69 | Exceptional 4.4% |