Creek vs Haitian Unemployment Among Ages 65 to 74 years
COMPARE
Creek
Haitian
Unemployment Among Ages 65 to 74 years
Unemployment Among Ages 65 to 74 years Comparison
Creek
Haitians
4.8%
UNEMPLOYMENT AMONG AGES 65 TO 74 YEARS
100.0/ 100
METRIC RATING
18th/ 347
METRIC RANK
5.5%
UNEMPLOYMENT AMONG AGES 65 TO 74 YEARS
7.7/ 100
METRIC RATING
212th/ 347
METRIC RANK
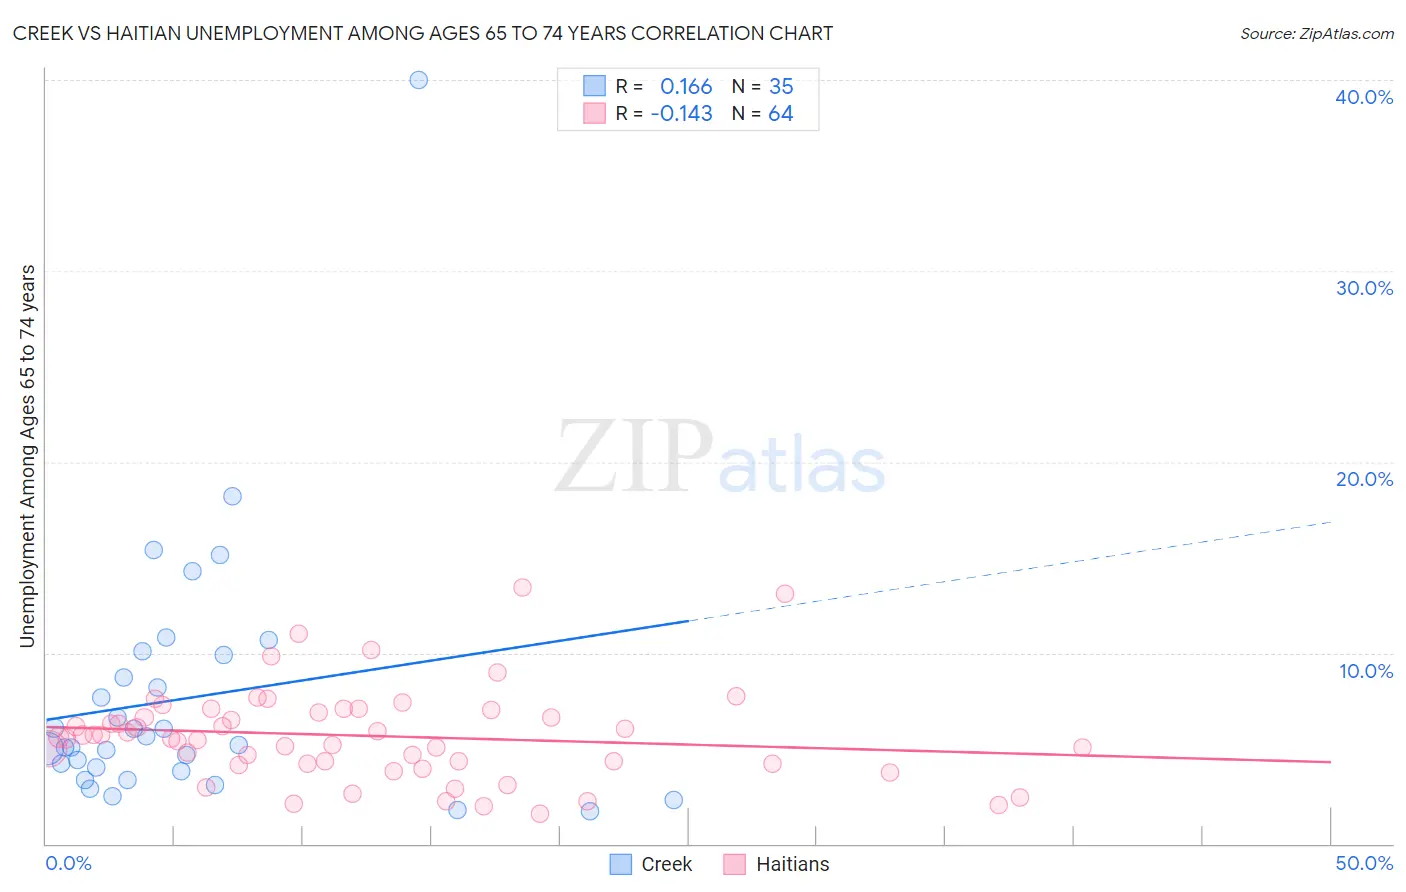
Creek vs Haitian Unemployment Among Ages 65 to 74 years Correlation Chart
The statistical analysis conducted on geographies consisting of 162,315,909 people shows a poor positive correlation between the proportion of Creek and unemployment rate among population between the ages 65 and 74 in the United States with a correlation coefficient (R) of 0.166 and weighted average of 4.8%. Similarly, the statistical analysis conducted on geographies consisting of 261,169,491 people shows a poor negative correlation between the proportion of Haitians and unemployment rate among population between the ages 65 and 74 in the United States with a correlation coefficient (R) of -0.143 and weighted average of 5.5%, a difference of 13.5%.
Unemployment Among Ages 65 to 74 years Correlation Summary
| Measurement | Creek | Haitian |
| Minimum | 1.7% | 1.6% |
| Maximum | 40.0% | 13.4% |
| Range | 38.3% | 11.8% |
| Mean | 7.6% | 5.7% |
| Median | 5.2% | 5.5% |
| Interquartile 25% (IQ1) | 3.8% | 4.2% |
| Interquartile 75% (IQ3) | 9.9% | 7.0% |
| Interquartile Range (IQR) | 6.1% | 2.8% |
| Standard Deviation (Sample) | 7.0% | 2.4% |
| Standard Deviation (Population) | 6.9% | 2.4% |
Similar Demographics by Unemployment Among Ages 65 to 74 years
Demographics Similar to Creek by Unemployment Among Ages 65 to 74 years
In terms of unemployment among ages 65 to 74 years, the demographic groups most similar to Creek are Menominee (4.8%, a difference of 0.050%), Kenyan (4.8%, a difference of 0.080%), Immigrants from Burma/Myanmar (4.8%, a difference of 0.090%), Immigrants from Zaire (4.8%, a difference of 0.30%), and Immigrants from North Macedonia (4.8%, a difference of 0.39%).
| Demographics | Rating | Rank | Unemployment Among Ages 65 to 74 years |
| Immigrants | Congo | 100.0 /100 | #11 | Exceptional 4.7% |
| Tongans | 100.0 /100 | #12 | Exceptional 4.7% |
| Lumbee | 100.0 /100 | #13 | Exceptional 4.8% |
| Cubans | 100.0 /100 | #14 | Exceptional 4.8% |
| Immigrants | North Macedonia | 100.0 /100 | #15 | Exceptional 4.8% |
| Immigrants | Burma/Myanmar | 100.0 /100 | #16 | Exceptional 4.8% |
| Kenyans | 100.0 /100 | #17 | Exceptional 4.8% |
| Creek | 100.0 /100 | #18 | Exceptional 4.8% |
| Menominee | 100.0 /100 | #19 | Exceptional 4.8% |
| Immigrants | Zaire | 100.0 /100 | #20 | Exceptional 4.8% |
| Immigrants | Eritrea | 100.0 /100 | #21 | Exceptional 4.9% |
| Lebanese | 100.0 /100 | #22 | Exceptional 4.9% |
| Immigrants | Nepal | 100.0 /100 | #23 | Exceptional 4.9% |
| Iraqis | 100.0 /100 | #24 | Exceptional 4.9% |
| Macedonians | 100.0 /100 | #25 | Exceptional 5.0% |
Demographics Similar to Haitians by Unemployment Among Ages 65 to 74 years
In terms of unemployment among ages 65 to 74 years, the demographic groups most similar to Haitians are Italian (5.5%, a difference of 0.010%), Egyptian (5.5%, a difference of 0.010%), American (5.5%, a difference of 0.050%), Immigrants from Croatia (5.5%, a difference of 0.14%), and Uruguayan (5.5%, a difference of 0.19%).
| Demographics | Rating | Rank | Unemployment Among Ages 65 to 74 years |
| Icelanders | 14.2 /100 | #205 | Poor 5.4% |
| Africans | 12.8 /100 | #206 | Poor 5.5% |
| Immigrants | Uzbekistan | 12.5 /100 | #207 | Poor 5.5% |
| Dutch West Indians | 11.5 /100 | #208 | Poor 5.5% |
| Immigrants | Honduras | 10.4 /100 | #209 | Poor 5.5% |
| Immigrants | Northern Africa | 10.1 /100 | #210 | Poor 5.5% |
| Immigrants | Croatia | 9.1 /100 | #211 | Tragic 5.5% |
| Haitians | 7.7 /100 | #212 | Tragic 5.5% |
| Italians | 7.7 /100 | #213 | Tragic 5.5% |
| Egyptians | 7.6 /100 | #214 | Tragic 5.5% |
| Americans | 7.3 /100 | #215 | Tragic 5.5% |
| Uruguayans | 6.2 /100 | #216 | Tragic 5.5% |
| Blackfeet | 5.8 /100 | #217 | Tragic 5.5% |
| Samoans | 5.7 /100 | #218 | Tragic 5.5% |
| Alsatians | 5.6 /100 | #219 | Tragic 5.5% |