Creek vs Blackfeet Unemployment Among Women with Children Under 6 years
COMPARE
Creek
Blackfeet
Unemployment Among Women with Children Under 6 years
Unemployment Among Women with Children Under 6 years Comparison
Creek
Blackfeet
8.9%
UNEMPLOYMENT AMONG WOMEN WITH CHILDREN UNDER 6 YEARS
0.0/ 100
METRIC RATING
300th/ 347
METRIC RANK
8.7%
UNEMPLOYMENT AMONG WOMEN WITH CHILDREN UNDER 6 YEARS
0.0/ 100
METRIC RATING
284th/ 347
METRIC RANK
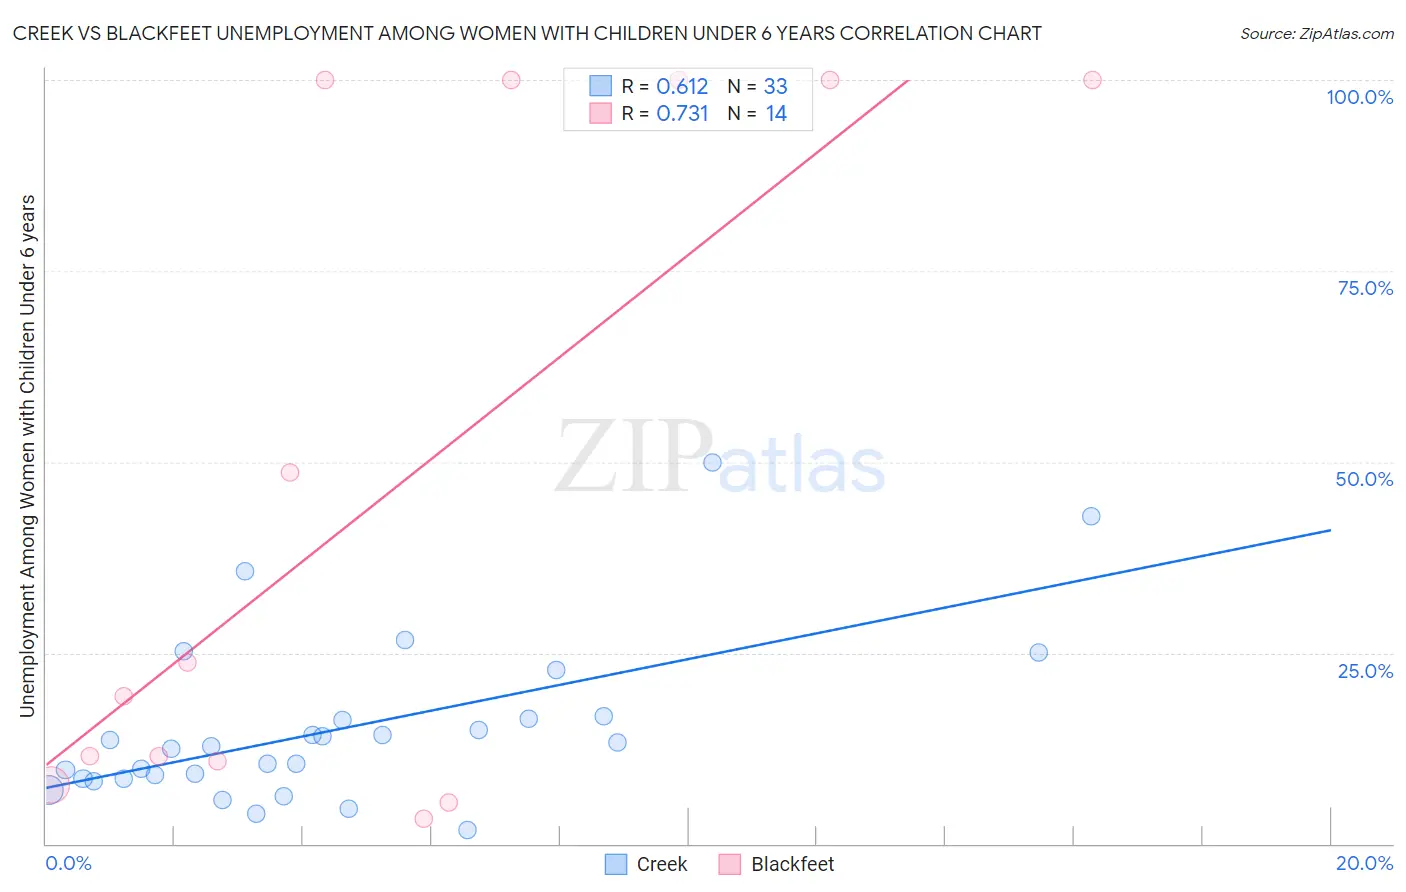
Creek vs Blackfeet Unemployment Among Women with Children Under 6 years Correlation Chart
The statistical analysis conducted on geographies consisting of 152,329,999 people shows a significant positive correlation between the proportion of Creek and unemployment rate among women with children under the age of 6 in the United States with a correlation coefficient (R) of 0.612 and weighted average of 8.9%. Similarly, the statistical analysis conducted on geographies consisting of 246,110,374 people shows a strong positive correlation between the proportion of Blackfeet and unemployment rate among women with children under the age of 6 in the United States with a correlation coefficient (R) of 0.731 and weighted average of 8.7%, a difference of 2.7%.
Unemployment Among Women with Children Under 6 years Correlation Summary
| Measurement | Creek | Blackfeet |
| Minimum | 1.8% | 3.2% |
| Maximum | 50.0% | 100.0% |
| Range | 48.2% | 96.8% |
| Mean | 15.1% | 45.8% |
| Median | 12.8% | 21.5% |
| Interquartile 25% (IQ1) | 8.5% | 10.7% |
| Interquartile 75% (IQ3) | 16.5% | 100.0% |
| Interquartile Range (IQR) | 8.0% | 89.3% |
| Standard Deviation (Sample) | 10.9% | 43.3% |
| Standard Deviation (Population) | 10.7% | 41.7% |
Demographics Similar to Creek and Blackfeet by Unemployment Among Women with Children Under 6 years
In terms of unemployment among women with children under 6 years, the demographic groups most similar to Creek are Immigrants from Jamaica (8.9%, a difference of 0.090%), Tlingit-Haida (8.9%, a difference of 0.30%), Mexican (8.9%, a difference of 0.46%), Chickasaw (9.0%, a difference of 0.53%), and Immigrants from Dominican Republic (8.9%, a difference of 0.55%). Similarly, the demographic groups most similar to Blackfeet are Spanish American Indian (8.7%, a difference of 0.16%), Bermudan (8.7%, a difference of 0.18%), U.S. Virgin Islander (8.7%, a difference of 0.20%), Seminole (8.7%, a difference of 0.20%), and Menominee (8.7%, a difference of 0.35%).
| Demographics | Rating | Rank | Unemployment Among Women with Children Under 6 years |
| Bermudans | 0.0 /100 | #282 | Tragic 8.7% |
| Spanish American Indians | 0.0 /100 | #283 | Tragic 8.7% |
| Blackfeet | 0.0 /100 | #284 | Tragic 8.7% |
| U.S. Virgin Islanders | 0.0 /100 | #285 | Tragic 8.7% |
| Seminole | 0.0 /100 | #286 | Tragic 8.7% |
| Menominee | 0.0 /100 | #287 | Tragic 8.7% |
| Bahamians | 0.0 /100 | #288 | Tragic 8.7% |
| Iroquois | 0.0 /100 | #289 | Tragic 8.7% |
| Vietnamese | 0.0 /100 | #290 | Tragic 8.8% |
| Jamaicans | 0.0 /100 | #291 | Tragic 8.8% |
| Cheyenne | 0.0 /100 | #292 | Tragic 8.8% |
| Immigrants | Bangladesh | 0.0 /100 | #293 | Tragic 8.8% |
| Immigrants | Nonimmigrants | 0.0 /100 | #294 | Tragic 8.8% |
| Immigrants | Central America | 0.0 /100 | #295 | Tragic 8.9% |
| Immigrants | Dominican Republic | 0.0 /100 | #296 | Tragic 8.9% |
| Mexicans | 0.0 /100 | #297 | Tragic 8.9% |
| Tlingit-Haida | 0.0 /100 | #298 | Tragic 8.9% |
| Immigrants | Jamaica | 0.0 /100 | #299 | Tragic 8.9% |
| Creek | 0.0 /100 | #300 | Tragic 8.9% |
| Chickasaw | 0.0 /100 | #301 | Tragic 9.0% |
| Hispanics or Latinos | 0.0 /100 | #302 | Tragic 9.0% |