Cree vs Immigrants from Cameroon Unemployment Among Seniors over 65 years
COMPARE
Cree
Immigrants from Cameroon
Unemployment Among Seniors over 65 years
Unemployment Among Seniors over 65 years Comparison
Cree
Immigrants from Cameroon
5.3%
UNEMPLOYMENT AMONG SENIORS OVER 65 YEARS
5.8/ 100
METRIC RATING
223rd/ 347
METRIC RANK
5.1%
UNEMPLOYMENT AMONG SENIORS OVER 65 YEARS
88.6/ 100
METRIC RATING
122nd/ 347
METRIC RANK
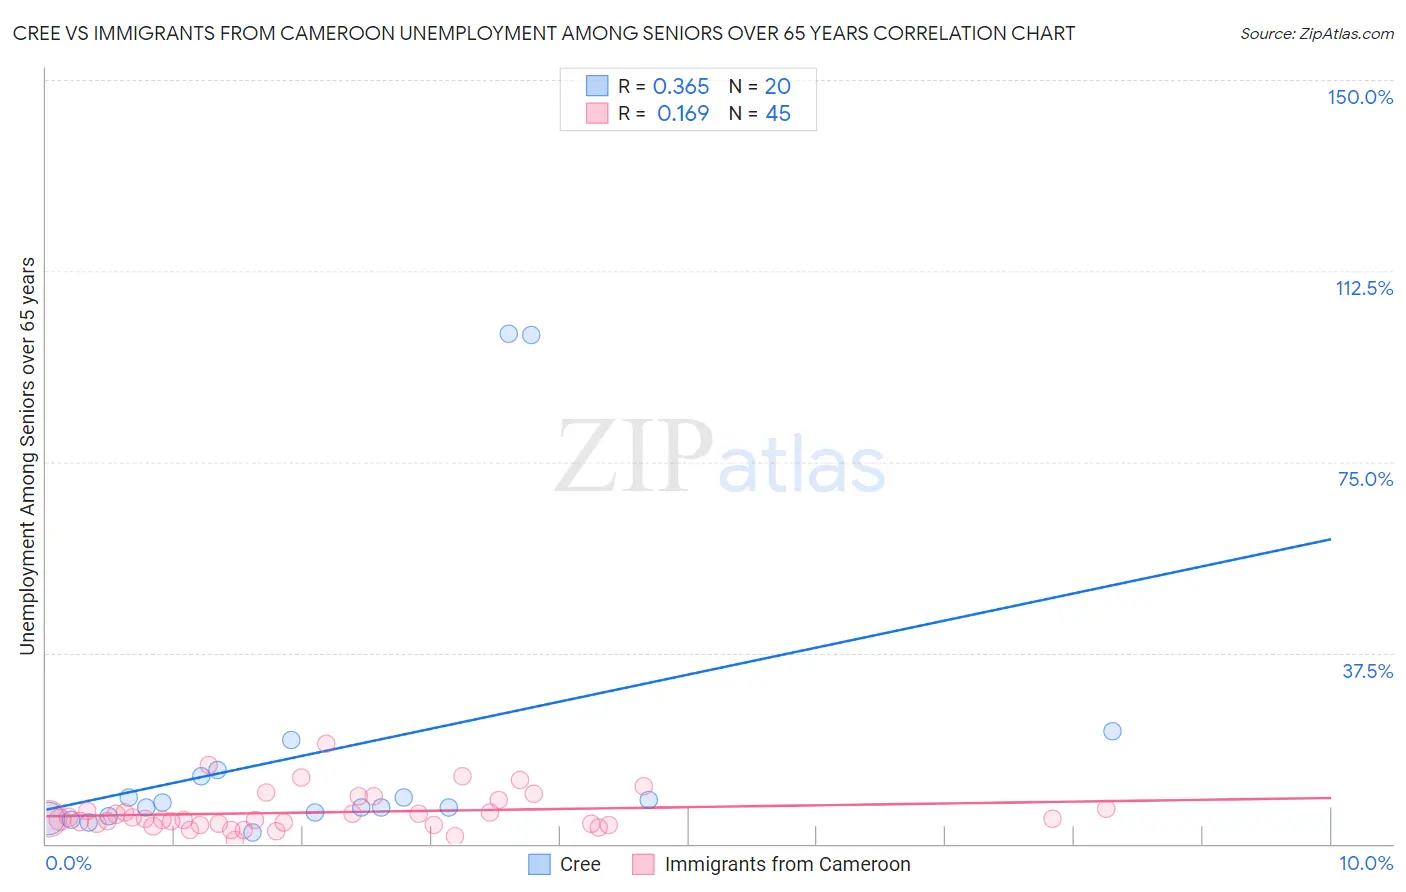
Cree vs Immigrants from Cameroon Unemployment Among Seniors over 65 years Correlation Chart
The statistical analysis conducted on geographies consisting of 73,743,775 people shows a mild positive correlation between the proportion of Cree and unemployment rate amomg seniors over the age of 65 in the United States with a correlation coefficient (R) of 0.365 and weighted average of 5.3%. Similarly, the statistical analysis conducted on geographies consisting of 125,322,101 people shows a poor positive correlation between the proportion of Immigrants from Cameroon and unemployment rate amomg seniors over the age of 65 in the United States with a correlation coefficient (R) of 0.169 and weighted average of 5.1%, a difference of 3.9%.
Unemployment Among Seniors over 65 years Correlation Summary
| Measurement | Cree | Immigrants from Cameroon |
| Minimum | 2.3% | 0.80% |
| Maximum | 100.1% | 19.6% |
| Range | 97.8% | 18.8% |
| Mean | 18.1% | 6.2% |
| Median | 7.7% | 4.9% |
| Interquartile 25% (IQ1) | 5.8% | 3.9% |
| Interquartile 75% (IQ3) | 13.8% | 7.6% |
| Interquartile Range (IQR) | 8.0% | 3.8% |
| Standard Deviation (Sample) | 28.5% | 3.9% |
| Standard Deviation (Population) | 27.8% | 3.8% |
Similar Demographics by Unemployment Among Seniors over 65 years
Demographics Similar to Cree by Unemployment Among Seniors over 65 years
In terms of unemployment among seniors over 65 years, the demographic groups most similar to Cree are Immigrants from Syria (5.3%, a difference of 0.020%), Honduran (5.3%, a difference of 0.030%), Israeli (5.3%, a difference of 0.060%), Immigrants from Croatia (5.3%, a difference of 0.070%), and Arapaho (5.3%, a difference of 0.080%).
| Demographics | Rating | Rank | Unemployment Among Seniors over 65 years |
| Cajuns | 8.5 /100 | #216 | Tragic 5.2% |
| Italians | 8.3 /100 | #217 | Tragic 5.2% |
| Spaniards | 7.4 /100 | #218 | Tragic 5.2% |
| Dutch West Indians | 6.9 /100 | #219 | Tragic 5.3% |
| Egyptians | 6.4 /100 | #220 | Tragic 5.3% |
| Arapaho | 6.3 /100 | #221 | Tragic 5.3% |
| Israelis | 6.2 /100 | #222 | Tragic 5.3% |
| Cree | 5.8 /100 | #223 | Tragic 5.3% |
| Immigrants | Syria | 5.6 /100 | #224 | Tragic 5.3% |
| Hondurans | 5.6 /100 | #225 | Tragic 5.3% |
| Immigrants | Croatia | 5.3 /100 | #226 | Tragic 5.3% |
| French American Indians | 5.2 /100 | #227 | Tragic 5.3% |
| Haitians | 4.4 /100 | #228 | Tragic 5.3% |
| Samoans | 4.2 /100 | #229 | Tragic 5.3% |
| Immigrants | Argentina | 4.0 /100 | #230 | Tragic 5.3% |
Demographics Similar to Immigrants from Cameroon by Unemployment Among Seniors over 65 years
In terms of unemployment among seniors over 65 years, the demographic groups most similar to Immigrants from Cameroon are Asian (5.1%, a difference of 0.0%), Puget Sound Salish (5.1%, a difference of 0.010%), Irish (5.1%, a difference of 0.020%), Immigrants from North America (5.1%, a difference of 0.050%), and Dutch (5.1%, a difference of 0.070%).
| Demographics | Rating | Rank | Unemployment Among Seniors over 65 years |
| Celtics | 91.3 /100 | #115 | Exceptional 5.0% |
| Immigrants | Korea | 91.0 /100 | #116 | Exceptional 5.0% |
| Malaysians | 90.4 /100 | #117 | Exceptional 5.1% |
| Soviet Union | 90.1 /100 | #118 | Exceptional 5.1% |
| Immigrants | Canada | 89.7 /100 | #119 | Excellent 5.1% |
| Irish | 88.8 /100 | #120 | Excellent 5.1% |
| Puget Sound Salish | 88.7 /100 | #121 | Excellent 5.1% |
| Immigrants | Cameroon | 88.6 /100 | #122 | Excellent 5.1% |
| Asians | 88.5 /100 | #123 | Excellent 5.1% |
| Immigrants | North America | 87.9 /100 | #124 | Excellent 5.1% |
| Dutch | 87.6 /100 | #125 | Excellent 5.1% |
| Immigrants | Sri Lanka | 87.4 /100 | #126 | Excellent 5.1% |
| Sri Lankans | 87.4 /100 | #127 | Excellent 5.1% |
| Australians | 87.1 /100 | #128 | Excellent 5.1% |
| Immigrants | England | 86.7 /100 | #129 | Excellent 5.1% |