Costa Rican vs Yakama Unemployment Among Ages 55 to 59 years
COMPARE
Costa Rican
Yakama
Unemployment Among Ages 55 to 59 years
Unemployment Among Ages 55 to 59 years Comparison
Costa Ricans
Yakama
5.0%
UNEMPLOYMENT AMONG AGES 55 TO 59 YEARS
4.4/ 100
METRIC RATING
225th/ 347
METRIC RANK
8.9%
UNEMPLOYMENT AMONG AGES 55 TO 59 YEARS
0.0/ 100
METRIC RATING
343rd/ 347
METRIC RANK
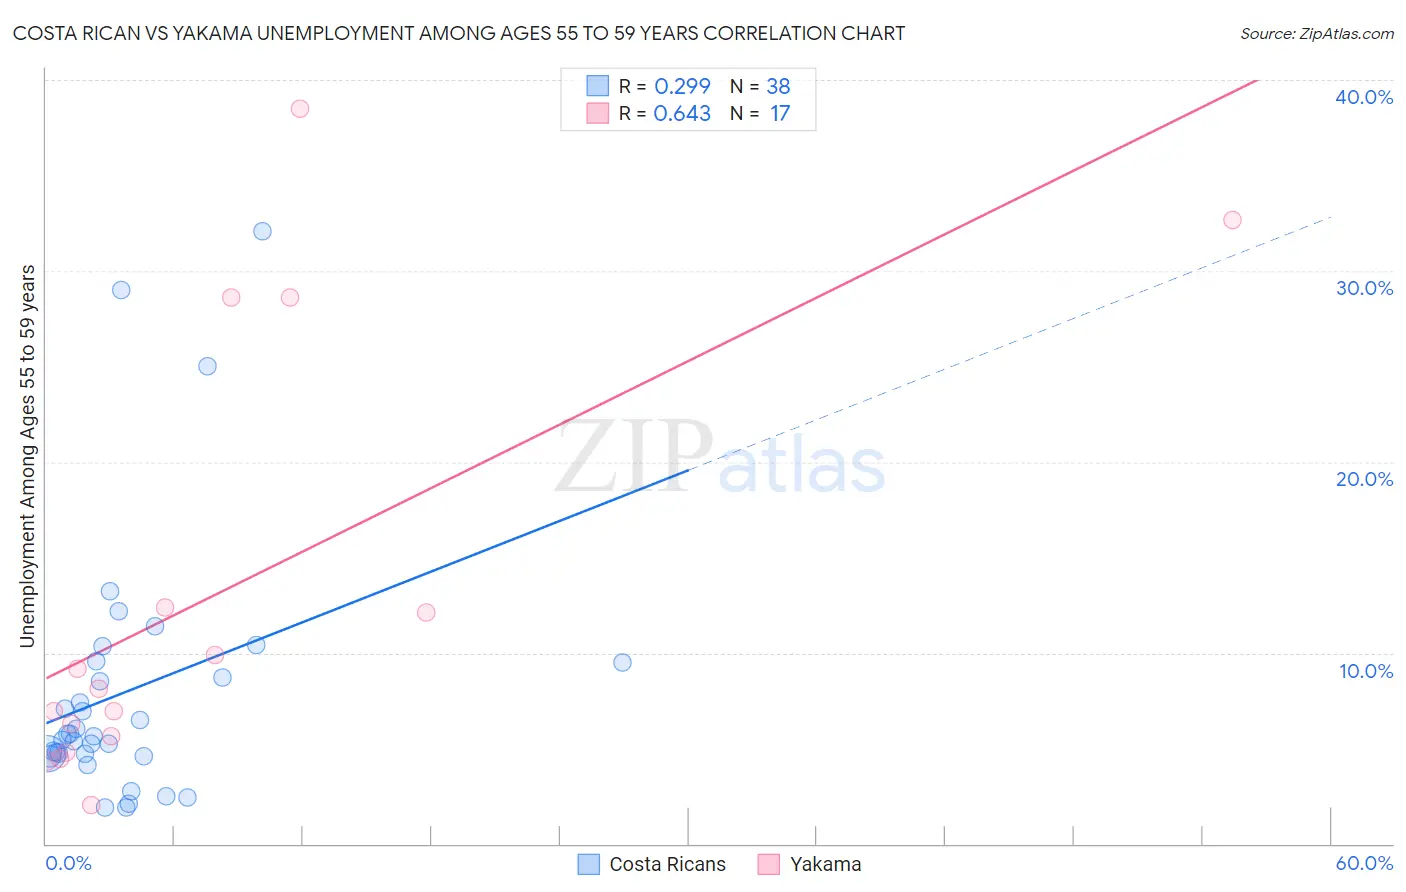
Costa Rican vs Yakama Unemployment Among Ages 55 to 59 years Correlation Chart
The statistical analysis conducted on geographies consisting of 243,507,911 people shows a weak positive correlation between the proportion of Costa Ricans and unemployment rate among population between the ages 55 and 59 in the United States with a correlation coefficient (R) of 0.299 and weighted average of 5.0%. Similarly, the statistical analysis conducted on geographies consisting of 19,170,351 people shows a significant positive correlation between the proportion of Yakama and unemployment rate among population between the ages 55 and 59 in the United States with a correlation coefficient (R) of 0.643 and weighted average of 8.9%, a difference of 79.7%.
Unemployment Among Ages 55 to 59 years Correlation Summary
| Measurement | Costa Rican | Yakama |
| Minimum | 1.9% | 2.0% |
| Maximum | 32.1% | 38.5% |
| Range | 30.2% | 36.5% |
| Mean | 8.0% | 13.0% |
| Median | 5.7% | 8.1% |
| Interquartile 25% (IQ1) | 4.7% | 5.2% |
| Interquartile 75% (IQ3) | 9.5% | 20.5% |
| Interquartile Range (IQR) | 4.8% | 15.3% |
| Standard Deviation (Sample) | 6.8% | 11.4% |
| Standard Deviation (Population) | 6.7% | 11.1% |
Similar Demographics by Unemployment Among Ages 55 to 59 years
Demographics Similar to Costa Ricans by Unemployment Among Ages 55 to 59 years
In terms of unemployment among ages 55 to 59 years, the demographic groups most similar to Costa Ricans are Subsaharan African (5.0%, a difference of 0.010%), Immigrants from China (5.0%, a difference of 0.050%), Immigrants from Ireland (5.0%, a difference of 0.090%), Spanish (5.0%, a difference of 0.15%), and Immigrants from Iran (5.0%, a difference of 0.18%).
| Demographics | Rating | Rank | Unemployment Among Ages 55 to 59 years |
| Immigrants | Austria | 8.0 /100 | #218 | Tragic 4.9% |
| Immigrants | Nigeria | 8.0 /100 | #219 | Tragic 4.9% |
| Indians (Asian) | 7.6 /100 | #220 | Tragic 4.9% |
| Nigerians | 7.5 /100 | #221 | Tragic 4.9% |
| Spanish | 5.1 /100 | #222 | Tragic 5.0% |
| Immigrants | Ireland | 4.8 /100 | #223 | Tragic 5.0% |
| Sub-Saharan Africans | 4.4 /100 | #224 | Tragic 5.0% |
| Costa Ricans | 4.4 /100 | #225 | Tragic 5.0% |
| Immigrants | China | 4.2 /100 | #226 | Tragic 5.0% |
| Immigrants | Iran | 3.7 /100 | #227 | Tragic 5.0% |
| Immigrants | Liberia | 3.2 /100 | #228 | Tragic 5.0% |
| Immigrants | Western Asia | 3.0 /100 | #229 | Tragic 5.0% |
| Immigrants | Syria | 2.7 /100 | #230 | Tragic 5.0% |
| Cherokee | 2.6 /100 | #231 | Tragic 5.0% |
| Albanians | 2.5 /100 | #232 | Tragic 5.0% |
Demographics Similar to Yakama by Unemployment Among Ages 55 to 59 years
In terms of unemployment among ages 55 to 59 years, the demographic groups most similar to Yakama are Inupiat (9.0%, a difference of 1.2%), Tohono O'odham (9.3%, a difference of 4.3%), Hopi (8.1%, a difference of 10.0%), Menominee (10.5%, a difference of 18.0%), and Shoshone (7.4%, a difference of 21.1%).
| Demographics | Rating | Rank | Unemployment Among Ages 55 to 59 years |
| Pima | 0.0 /100 | #333 | Tragic 6.6% |
| Pueblo | 0.0 /100 | #334 | Tragic 6.7% |
| Colville | 0.0 /100 | #335 | Tragic 6.7% |
| Navajo | 0.0 /100 | #336 | Tragic 6.7% |
| Paiute | 0.0 /100 | #337 | Tragic 6.8% |
| Immigrants | Yemen | 0.0 /100 | #338 | Tragic 6.9% |
| Puerto Ricans | 0.0 /100 | #339 | Tragic 7.0% |
| Alaskan Athabascans | 0.0 /100 | #340 | Tragic 7.1% |
| Shoshone | 0.0 /100 | #341 | Tragic 7.4% |
| Hopi | 0.0 /100 | #342 | Tragic 8.1% |
| Yakama | 0.0 /100 | #343 | Tragic 8.9% |
| Inupiat | 0.0 /100 | #344 | Tragic 9.0% |
| Tohono O'odham | 0.0 /100 | #345 | Tragic 9.3% |
| Menominee | 0.0 /100 | #346 | Tragic 10.5% |
| Yup'ik | 0.0 /100 | #347 | Tragic 13.9% |