Costa Rican vs Spanish American Indian Unemployment Among Ages 45 to 54 years
COMPARE
Costa Rican
Spanish American Indian
Unemployment Among Ages 45 to 54 years
Unemployment Among Ages 45 to 54 years Comparison
Costa Ricans
Spanish American Indians
4.5%
UNEMPLOYMENT AMONG AGES 45 TO 54 YEARS
75.3/ 100
METRIC RATING
149th/ 347
METRIC RANK
5.1%
UNEMPLOYMENT AMONG AGES 45 TO 54 YEARS
0.0/ 100
METRIC RATING
281st/ 347
METRIC RANK
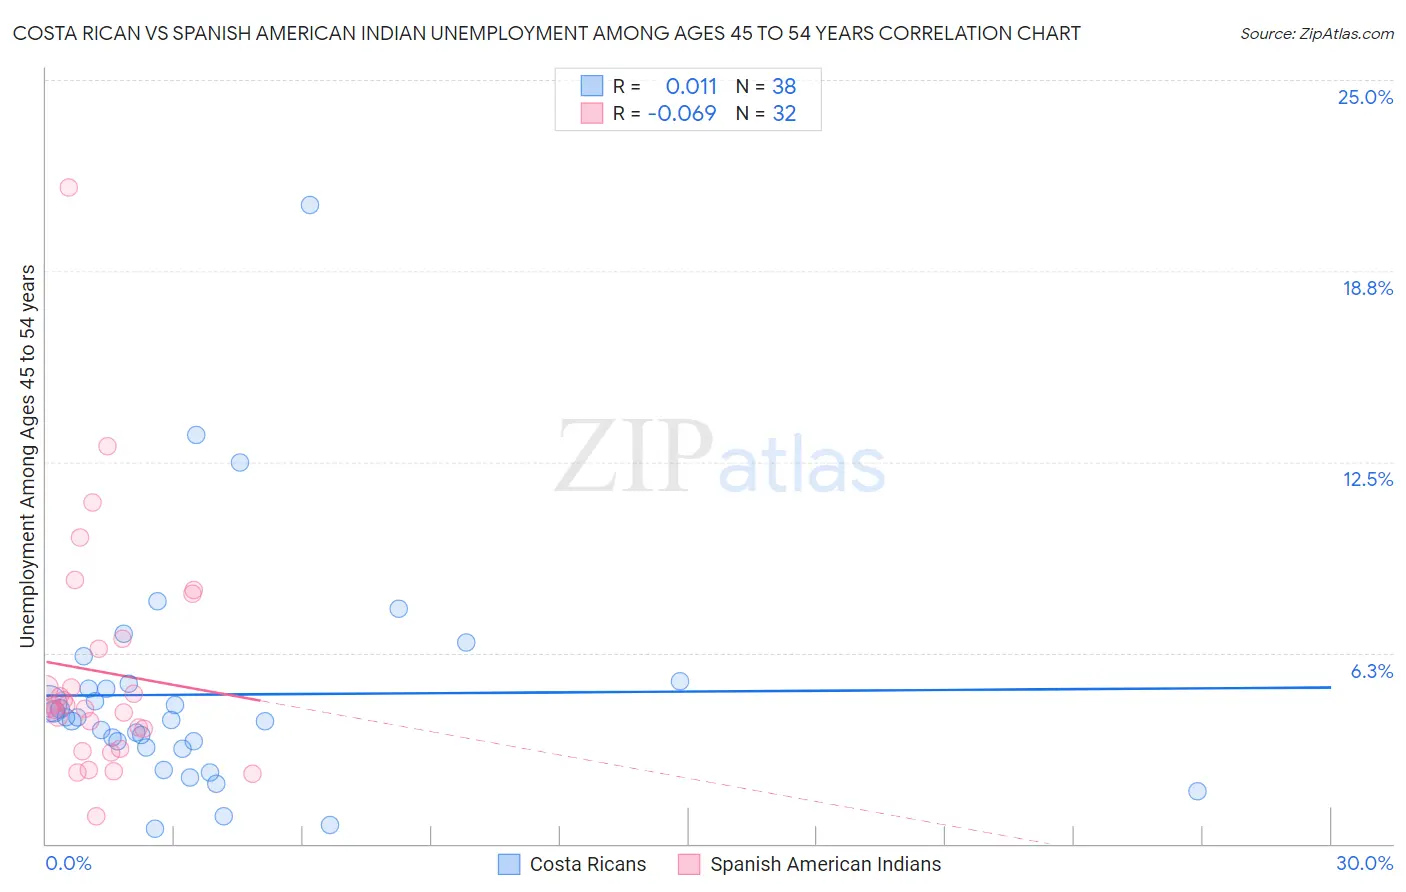
Costa Rican vs Spanish American Indian Unemployment Among Ages 45 to 54 years Correlation Chart
The statistical analysis conducted on geographies consisting of 250,528,385 people shows no correlation between the proportion of Costa Ricans and unemployment rate among population between the ages 45 and 54 in the United States with a correlation coefficient (R) of 0.011 and weighted average of 4.5%. Similarly, the statistical analysis conducted on geographies consisting of 72,831,869 people shows a slight negative correlation between the proportion of Spanish American Indians and unemployment rate among population between the ages 45 and 54 in the United States with a correlation coefficient (R) of -0.069 and weighted average of 5.1%, a difference of 13.3%.
Unemployment Among Ages 45 to 54 years Correlation Summary
| Measurement | Costa Rican | Spanish American Indian |
| Minimum | 0.50% | 0.90% |
| Maximum | 20.9% | 21.5% |
| Range | 20.4% | 20.6% |
| Mean | 4.9% | 5.6% |
| Median | 4.1% | 4.5% |
| Interquartile 25% (IQ1) | 3.1% | 3.4% |
| Interquartile 75% (IQ3) | 5.2% | 6.6% |
| Interquartile Range (IQR) | 2.1% | 3.1% |
| Standard Deviation (Sample) | 3.8% | 4.0% |
| Standard Deviation (Population) | 3.7% | 3.9% |
Similar Demographics by Unemployment Among Ages 45 to 54 years
Demographics Similar to Costa Ricans by Unemployment Among Ages 45 to 54 years
In terms of unemployment among ages 45 to 54 years, the demographic groups most similar to Costa Ricans are Immigrants from Austria (4.5%, a difference of 0.0%), Tsimshian (4.5%, a difference of 0.040%), Cypriot (4.5%, a difference of 0.060%), Uruguayan (4.5%, a difference of 0.10%), and Syrian (4.5%, a difference of 0.13%).
| Demographics | Rating | Rank | Unemployment Among Ages 45 to 54 years |
| Immigrants | Netherlands | 79.4 /100 | #142 | Good 4.4% |
| Macedonians | 79.0 /100 | #143 | Good 4.5% |
| Taiwanese | 77.9 /100 | #144 | Good 4.5% |
| Immigrants | Latvia | 77.5 /100 | #145 | Good 4.5% |
| Syrians | 77.3 /100 | #146 | Good 4.5% |
| Uruguayans | 76.9 /100 | #147 | Good 4.5% |
| Immigrants | Austria | 75.3 /100 | #148 | Good 4.5% |
| Costa Ricans | 75.3 /100 | #149 | Good 4.5% |
| Tsimshian | 74.6 /100 | #150 | Good 4.5% |
| Cypriots | 74.4 /100 | #151 | Good 4.5% |
| Koreans | 73.1 /100 | #152 | Good 4.5% |
| Hungarians | 73.0 /100 | #153 | Good 4.5% |
| Immigrants | Spain | 72.5 /100 | #154 | Good 4.5% |
| Marshallese | 70.6 /100 | #155 | Good 4.5% |
| Immigrants | Croatia | 69.6 /100 | #156 | Good 4.5% |
Demographics Similar to Spanish American Indians by Unemployment Among Ages 45 to 54 years
In terms of unemployment among ages 45 to 54 years, the demographic groups most similar to Spanish American Indians are Blackfeet (5.1%, a difference of 0.080%), African (5.1%, a difference of 0.15%), Nepalese (5.0%, a difference of 0.29%), Dutch West Indian (5.0%, a difference of 0.42%), and Hispanic or Latino (5.1%, a difference of 0.56%).
| Demographics | Rating | Rank | Unemployment Among Ages 45 to 54 years |
| U.S. Virgin Islanders | 0.0 /100 | #274 | Tragic 5.0% |
| Bermudans | 0.0 /100 | #275 | Tragic 5.0% |
| French American Indians | 0.0 /100 | #276 | Tragic 5.0% |
| Immigrants | Mexico | 0.0 /100 | #277 | Tragic 5.0% |
| Dutch West Indians | 0.0 /100 | #278 | Tragic 5.0% |
| Nepalese | 0.0 /100 | #279 | Tragic 5.0% |
| Blackfeet | 0.0 /100 | #280 | Tragic 5.1% |
| Spanish American Indians | 0.0 /100 | #281 | Tragic 5.1% |
| Africans | 0.0 /100 | #282 | Tragic 5.1% |
| Hispanics or Latinos | 0.0 /100 | #283 | Tragic 5.1% |
| Kiowa | 0.0 /100 | #284 | Tragic 5.1% |
| Iroquois | 0.0 /100 | #285 | Tragic 5.1% |
| Senegalese | 0.0 /100 | #286 | Tragic 5.1% |
| Haitians | 0.0 /100 | #287 | Tragic 5.2% |
| Immigrants | Caribbean | 0.0 /100 | #288 | Tragic 5.2% |