Costa Rican vs Paraguayan Unemployment Among Women with Children Under 6 years
COMPARE
Costa Rican
Paraguayan
Unemployment Among Women with Children Under 6 years
Unemployment Among Women with Children Under 6 years Comparison
Costa Ricans
Paraguayans
7.8%
UNEMPLOYMENT AMONG WOMEN WITH CHILDREN UNDER 6 YEARS
17.6/ 100
METRIC RATING
209th/ 347
METRIC RANK
7.0%
UNEMPLOYMENT AMONG WOMEN WITH CHILDREN UNDER 6 YEARS
99.4/ 100
METRIC RATING
68th/ 347
METRIC RANK
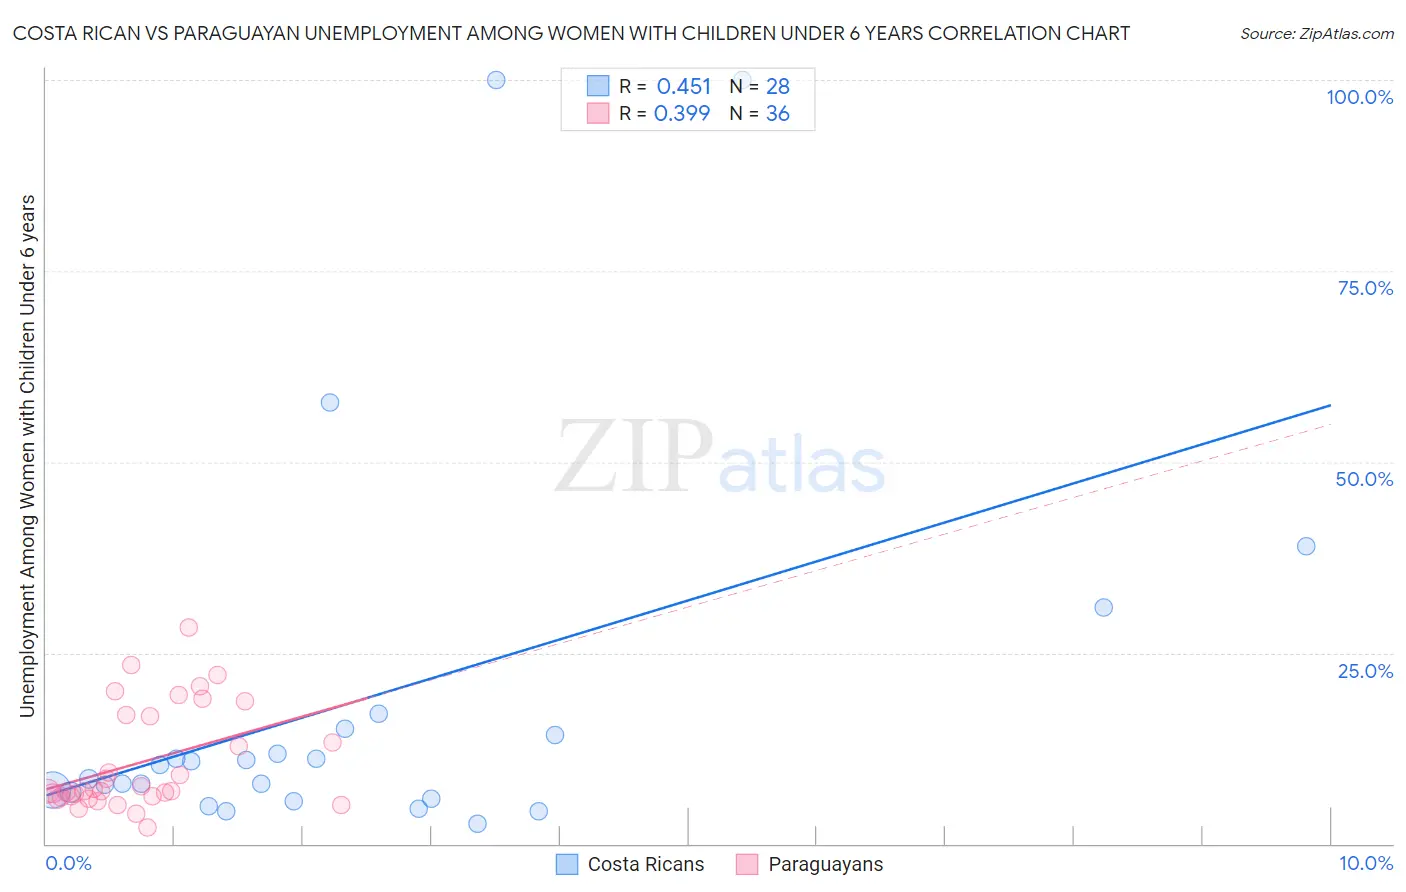
Costa Rican vs Paraguayan Unemployment Among Women with Children Under 6 years Correlation Chart
The statistical analysis conducted on geographies consisting of 211,982,760 people shows a moderate positive correlation between the proportion of Costa Ricans and unemployment rate among women with children under the age of 6 in the United States with a correlation coefficient (R) of 0.451 and weighted average of 7.8%. Similarly, the statistical analysis conducted on geographies consisting of 85,742,352 people shows a mild positive correlation between the proportion of Paraguayans and unemployment rate among women with children under the age of 6 in the United States with a correlation coefficient (R) of 0.399 and weighted average of 7.0%, a difference of 12.2%.
Unemployment Among Women with Children Under 6 years Correlation Summary
| Measurement | Costa Rican | Paraguayan |
| Minimum | 2.6% | 2.1% |
| Maximum | 100.0% | 28.3% |
| Range | 97.4% | 26.2% |
| Mean | 18.8% | 10.6% |
| Median | 9.4% | 6.8% |
| Interquartile 25% (IQ1) | 6.3% | 6.2% |
| Interquartile 75% (IQ3) | 14.7% | 16.8% |
| Interquartile Range (IQR) | 8.4% | 10.6% |
| Standard Deviation (Sample) | 25.8% | 6.7% |
| Standard Deviation (Population) | 25.3% | 6.6% |
Similar Demographics by Unemployment Among Women with Children Under 6 years
Demographics Similar to Costa Ricans by Unemployment Among Women with Children Under 6 years
In terms of unemployment among women with children under 6 years, the demographic groups most similar to Costa Ricans are Immigrants from Syria (7.8%, a difference of 0.14%), Polish (7.9%, a difference of 0.18%), Immigrants from Ecuador (7.9%, a difference of 0.31%), Canadian (7.8%, a difference of 0.32%), and Hungarian (7.8%, a difference of 0.37%).
| Demographics | Rating | Rank | Unemployment Among Women with Children Under 6 years |
| Sudanese | 23.5 /100 | #202 | Fair 7.8% |
| Spaniards | 23.3 /100 | #203 | Fair 7.8% |
| Lebanese | 22.2 /100 | #204 | Fair 7.8% |
| Immigrants | Immigrants | 21.4 /100 | #205 | Fair 7.8% |
| Hungarians | 21.2 /100 | #206 | Fair 7.8% |
| Canadians | 20.6 /100 | #207 | Fair 7.8% |
| Immigrants | Syria | 18.9 /100 | #208 | Poor 7.8% |
| Costa Ricans | 17.6 /100 | #209 | Poor 7.8% |
| Poles | 16.0 /100 | #210 | Poor 7.9% |
| Immigrants | Ecuador | 14.9 /100 | #211 | Poor 7.9% |
| Swiss | 12.3 /100 | #212 | Poor 7.9% |
| Scottish | 11.4 /100 | #213 | Poor 7.9% |
| Spanish | 11.3 /100 | #214 | Poor 7.9% |
| Ecuadorians | 11.2 /100 | #215 | Poor 7.9% |
| Immigrants | Lebanon | 11.1 /100 | #216 | Poor 7.9% |
Demographics Similar to Paraguayans by Unemployment Among Women with Children Under 6 years
In terms of unemployment among women with children under 6 years, the demographic groups most similar to Paraguayans are Immigrants from Eritrea (7.0%, a difference of 0.030%), Immigrants from Iraq (7.0%, a difference of 0.050%), Afghan (7.0%, a difference of 0.070%), Cuban (7.0%, a difference of 0.18%), and Immigrants from Netherlands (7.0%, a difference of 0.22%).
| Demographics | Rating | Rank | Unemployment Among Women with Children Under 6 years |
| Immigrants | France | 99.7 /100 | #61 | Exceptional 6.9% |
| Somalis | 99.7 /100 | #62 | Exceptional 6.9% |
| Maltese | 99.7 /100 | #63 | Exceptional 6.9% |
| Tongans | 99.7 /100 | #64 | Exceptional 6.9% |
| Immigrants | Kuwait | 99.7 /100 | #65 | Exceptional 6.9% |
| Immigrants | Belgium | 99.6 /100 | #66 | Exceptional 6.9% |
| Immigrants | Netherlands | 99.5 /100 | #67 | Exceptional 7.0% |
| Paraguayans | 99.4 /100 | #68 | Exceptional 7.0% |
| Immigrants | Eritrea | 99.4 /100 | #69 | Exceptional 7.0% |
| Immigrants | Iraq | 99.4 /100 | #70 | Exceptional 7.0% |
| Afghans | 99.4 /100 | #71 | Exceptional 7.0% |
| Cubans | 99.4 /100 | #72 | Exceptional 7.0% |
| Immigrants | Czechoslovakia | 99.2 /100 | #73 | Exceptional 7.0% |
| Turks | 99.2 /100 | #74 | Exceptional 7.0% |
| Immigrants | Eastern Europe | 99.0 /100 | #75 | Exceptional 7.1% |