Costa Rican vs Immigrants from Mexico Unemployment Among Ages 65 to 74 years
COMPARE
Costa Rican
Immigrants from Mexico
Unemployment Among Ages 65 to 74 years
Unemployment Among Ages 65 to 74 years Comparison
Costa Ricans
Immigrants from Mexico
5.4%
UNEMPLOYMENT AMONG AGES 65 TO 74 YEARS
21.1/ 100
METRIC RATING
196th/ 347
METRIC RANK
6.0%
UNEMPLOYMENT AMONG AGES 65 TO 74 YEARS
0.0/ 100
METRIC RATING
322nd/ 347
METRIC RANK
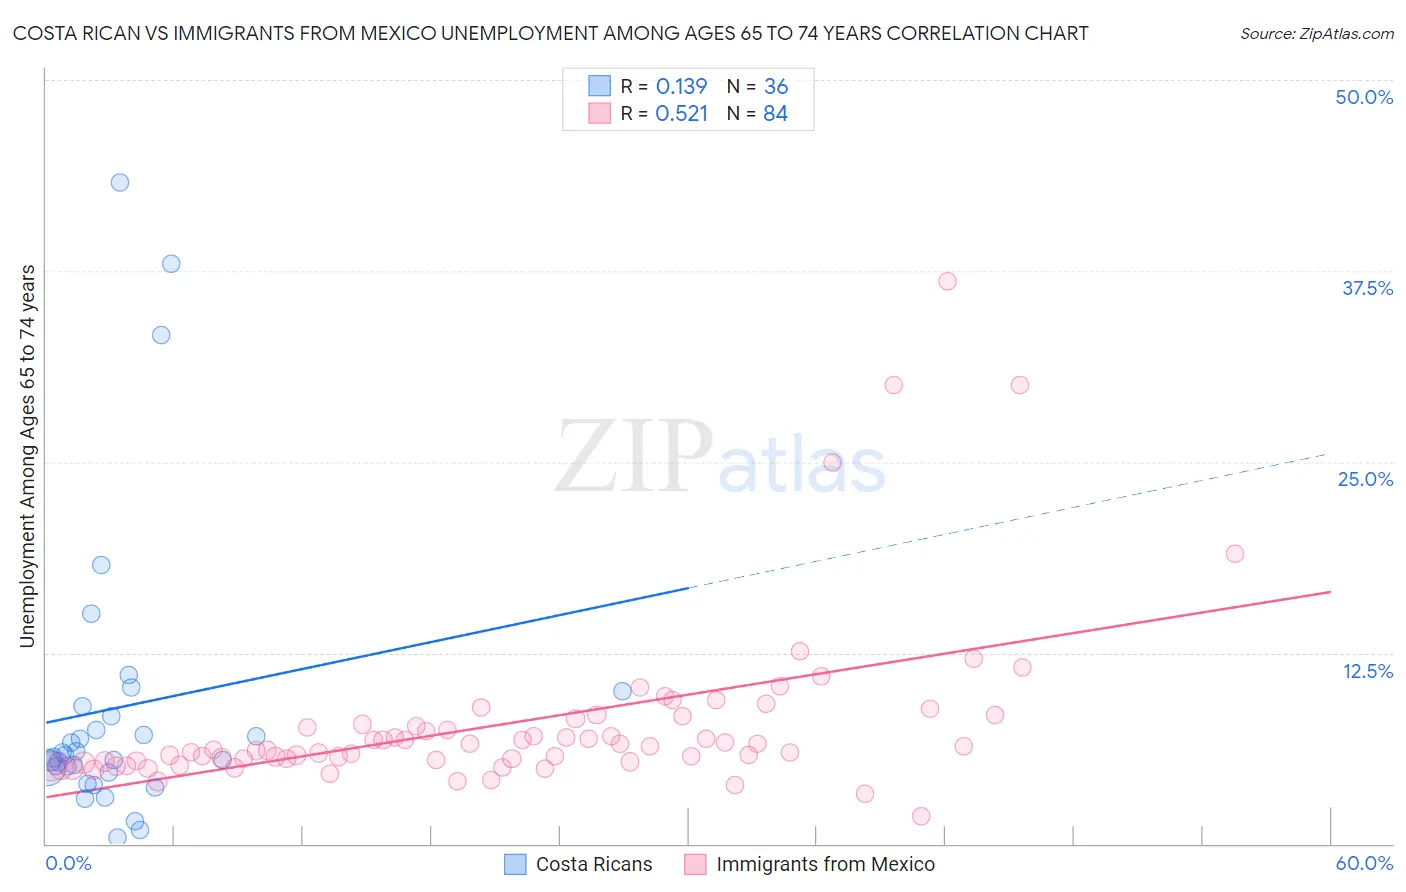
Costa Rican vs Immigrants from Mexico Unemployment Among Ages 65 to 74 years Correlation Chart
The statistical analysis conducted on geographies consisting of 235,269,735 people shows a poor positive correlation between the proportion of Costa Ricans and unemployment rate among population between the ages 65 and 74 in the United States with a correlation coefficient (R) of 0.139 and weighted average of 5.4%. Similarly, the statistical analysis conducted on geographies consisting of 419,156,044 people shows a substantial positive correlation between the proportion of Immigrants from Mexico and unemployment rate among population between the ages 65 and 74 in the United States with a correlation coefficient (R) of 0.521 and weighted average of 6.0%, a difference of 10.3%.
Unemployment Among Ages 65 to 74 years Correlation Summary
| Measurement | Costa Rican | Immigrants from Mexico |
| Minimum | 0.40% | 1.8% |
| Maximum | 43.3% | 36.8% |
| Range | 42.9% | 35.0% |
| Mean | 8.9% | 7.9% |
| Median | 5.7% | 6.3% |
| Interquartile 25% (IQ1) | 4.8% | 5.4% |
| Interquartile 75% (IQ3) | 8.7% | 8.0% |
| Interquartile Range (IQR) | 3.8% | 2.6% |
| Standard Deviation (Sample) | 9.7% | 5.7% |
| Standard Deviation (Population) | 9.5% | 5.6% |
Similar Demographics by Unemployment Among Ages 65 to 74 years
Demographics Similar to Costa Ricans by Unemployment Among Ages 65 to 74 years
In terms of unemployment among ages 65 to 74 years, the demographic groups most similar to Costa Ricans are Colville (5.4%, a difference of 0.030%), Immigrants from China (5.4%, a difference of 0.15%), Immigrants from Denmark (5.4%, a difference of 0.17%), Albanian (5.4%, a difference of 0.17%), and Cherokee (5.4%, a difference of 0.22%).
| Demographics | Rating | Rank | Unemployment Among Ages 65 to 74 years |
| Immigrants | Africa | 28.3 /100 | #189 | Fair 5.4% |
| Basques | 26.6 /100 | #190 | Fair 5.4% |
| Immigrants | Egypt | 26.5 /100 | #191 | Fair 5.4% |
| Maltese | 26.4 /100 | #192 | Fair 5.4% |
| Cherokee | 25.8 /100 | #193 | Fair 5.4% |
| Immigrants | Denmark | 24.7 /100 | #194 | Fair 5.4% |
| Immigrants | China | 24.2 /100 | #195 | Fair 5.4% |
| Costa Ricans | 21.1 /100 | #196 | Fair 5.4% |
| Colville | 20.4 /100 | #197 | Fair 5.4% |
| Albanians | 17.8 /100 | #198 | Poor 5.4% |
| Immigrants | Belgium | 16.2 /100 | #199 | Poor 5.4% |
| Immigrants | Pakistan | 15.2 /100 | #200 | Poor 5.4% |
| Immigrants | Western Asia | 14.9 /100 | #201 | Poor 5.4% |
| Sub-Saharan Africans | 14.4 /100 | #202 | Poor 5.4% |
| Argentineans | 14.3 /100 | #203 | Poor 5.4% |
Demographics Similar to Immigrants from Mexico by Unemployment Among Ages 65 to 74 years
In terms of unemployment among ages 65 to 74 years, the demographic groups most similar to Immigrants from Mexico are Delaware (6.0%, a difference of 0.060%), Immigrants from Dominica (6.0%, a difference of 0.22%), Immigrants from Bahamas (5.9%, a difference of 0.59%), Tohono O'odham (6.0%, a difference of 0.63%), and Aleut (5.9%, a difference of 0.68%).
| Demographics | Rating | Rank | Unemployment Among Ages 65 to 74 years |
| Immigrants | Guatemala | 0.0 /100 | #315 | Tragic 5.9% |
| Immigrants | El Salvador | 0.0 /100 | #316 | Tragic 5.9% |
| Immigrants | Central America | 0.0 /100 | #317 | Tragic 5.9% |
| Zimbabweans | 0.0 /100 | #318 | Tragic 5.9% |
| Aleuts | 0.0 /100 | #319 | Tragic 5.9% |
| Immigrants | Bahamas | 0.0 /100 | #320 | Tragic 5.9% |
| Immigrants | Dominica | 0.0 /100 | #321 | Tragic 6.0% |
| Immigrants | Mexico | 0.0 /100 | #322 | Tragic 6.0% |
| Delaware | 0.0 /100 | #323 | Tragic 6.0% |
| Tohono O'odham | 0.0 /100 | #324 | Tragic 6.0% |
| Immigrants | Portugal | 0.0 /100 | #325 | Tragic 6.0% |
| Natives/Alaskans | 0.0 /100 | #326 | Tragic 6.0% |
| Shoshone | 0.0 /100 | #327 | Tragic 6.2% |
| Immigrants | Azores | 0.0 /100 | #328 | Tragic 6.2% |
| Yuman | 0.0 /100 | #329 | Tragic 6.2% |