Colville vs Soviet Union Unemployment Among Ages 30 to 34 years
COMPARE
Colville
Soviet Union
Unemployment Among Ages 30 to 34 years
Unemployment Among Ages 30 to 34 years Comparison
Colville
Soviet Union
9.0%
UNEMPLOYMENT AMONG AGES 30 TO 34 YEARS
0.0/ 100
METRIC RATING
336th/ 347
METRIC RANK
5.0%
UNEMPLOYMENT AMONG AGES 30 TO 34 YEARS
98.8/ 100
METRIC RATING
43rd/ 347
METRIC RANK
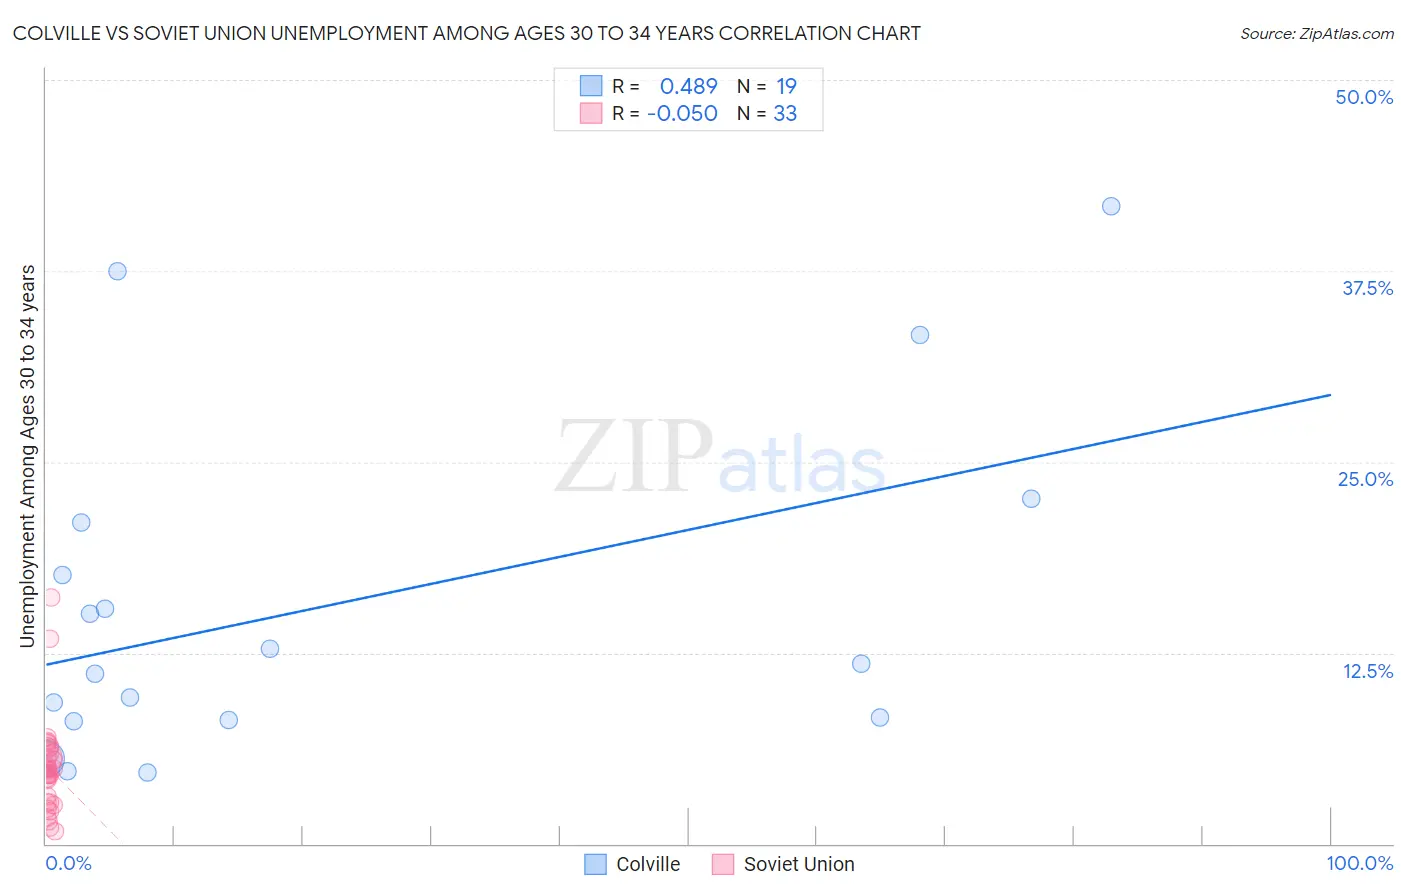
Colville vs Soviet Union Unemployment Among Ages 30 to 34 years Correlation Chart
The statistical analysis conducted on geographies consisting of 34,312,391 people shows a moderate positive correlation between the proportion of Colville and unemployment rate among population between the ages 30 and 34 in the United States with a correlation coefficient (R) of 0.489 and weighted average of 9.0%. Similarly, the statistical analysis conducted on geographies consisting of 43,078,343 people shows a slight negative correlation between the proportion of Soviet Union and unemployment rate among population between the ages 30 and 34 in the United States with a correlation coefficient (R) of -0.050 and weighted average of 5.0%, a difference of 79.3%.
Unemployment Among Ages 30 to 34 years Correlation Summary
| Measurement | Colville | Soviet Union |
| Minimum | 4.7% | 0.80% |
| Maximum | 41.7% | 16.1% |
| Range | 37.0% | 15.3% |
| Mean | 15.7% | 4.9% |
| Median | 11.8% | 4.8% |
| Interquartile 25% (IQ1) | 8.1% | 2.7% |
| Interquartile 75% (IQ3) | 21.0% | 6.1% |
| Interquartile Range (IQR) | 12.9% | 3.4% |
| Standard Deviation (Sample) | 11.0% | 3.1% |
| Standard Deviation (Population) | 10.7% | 3.0% |
Similar Demographics by Unemployment Among Ages 30 to 34 years
Demographics Similar to Colville by Unemployment Among Ages 30 to 34 years
In terms of unemployment among ages 30 to 34 years, the demographic groups most similar to Colville are Puerto Rican (8.9%, a difference of 1.9%), Alaska Native (8.5%, a difference of 6.5%), Pima (9.6%, a difference of 6.7%), Yakama (9.8%, a difference of 7.9%), and Tohono O'odham (9.8%, a difference of 8.7%).
| Demographics | Rating | Rank | Unemployment Among Ages 30 to 34 years |
| Cheyenne | 0.0 /100 | #329 | Tragic 7.8% |
| Shoshone | 0.0 /100 | #330 | Tragic 7.9% |
| Sioux | 0.0 /100 | #331 | Tragic 8.0% |
| Natives/Alaskans | 0.0 /100 | #332 | Tragic 8.2% |
| Pueblo | 0.0 /100 | #333 | Tragic 8.3% |
| Alaska Natives | 0.0 /100 | #334 | Tragic 8.5% |
| Puerto Ricans | 0.0 /100 | #335 | Tragic 8.9% |
| Colville | 0.0 /100 | #336 | Tragic 9.0% |
| Pima | 0.0 /100 | #337 | Tragic 9.6% |
| Yakama | 0.0 /100 | #338 | Tragic 9.8% |
| Tohono O'odham | 0.0 /100 | #339 | Tragic 9.8% |
| Crow | 0.0 /100 | #340 | Tragic 10.3% |
| Navajo | 0.0 /100 | #341 | Tragic 10.6% |
| Yuman | 0.0 /100 | #342 | Tragic 10.6% |
| Inupiat | 0.0 /100 | #343 | Tragic 10.8% |
Demographics Similar to Soviet Union by Unemployment Among Ages 30 to 34 years
In terms of unemployment among ages 30 to 34 years, the demographic groups most similar to Soviet Union are Immigrants from Hong Kong (5.0%, a difference of 0.10%), Immigrants from Belgium (5.1%, a difference of 0.14%), Yugoslavian (5.1%, a difference of 0.17%), Immigrants from Vietnam (5.0%, a difference of 0.28%), and Immigrants from Eastern Africa (5.0%, a difference of 0.28%).
| Demographics | Rating | Rank | Unemployment Among Ages 30 to 34 years |
| Czechs | 99.2 /100 | #36 | Exceptional 5.0% |
| Immigrants | Turkey | 99.0 /100 | #37 | Exceptional 5.0% |
| Sri Lankans | 99.0 /100 | #38 | Exceptional 5.0% |
| Fijians | 99.0 /100 | #39 | Exceptional 5.0% |
| Immigrants | Vietnam | 98.9 /100 | #40 | Exceptional 5.0% |
| Immigrants | Eastern Africa | 98.9 /100 | #41 | Exceptional 5.0% |
| Immigrants | Hong Kong | 98.8 /100 | #42 | Exceptional 5.0% |
| Soviet Union | 98.8 /100 | #43 | Exceptional 5.0% |
| Immigrants | Belgium | 98.7 /100 | #44 | Exceptional 5.1% |
| Yugoslavians | 98.6 /100 | #45 | Exceptional 5.1% |
| Immigrants | Congo | 98.4 /100 | #46 | Exceptional 5.1% |
| Cypriots | 98.4 /100 | #47 | Exceptional 5.1% |
| Assyrians/Chaldeans/Syriacs | 98.4 /100 | #48 | Exceptional 5.1% |
| Immigrants | Malaysia | 98.3 /100 | #49 | Exceptional 5.1% |
| Puget Sound Salish | 98.2 /100 | #50 | Exceptional 5.1% |