Colville vs Immigrants from South Eastern Asia Unemployment Among Youth under 25 years
COMPARE
Colville
Immigrants from South Eastern Asia
Unemployment Among Youth under 25 years
Unemployment Among Youth under 25 years Comparison
Colville
Immigrants from South Eastern Asia
16.8%
UNEMPLOYMENT AMONG YOUTH UNDER 25 YEARS
0.0/ 100
METRIC RATING
340th/ 347
METRIC RANK
11.6%
UNEMPLOYMENT AMONG YOUTH UNDER 25 YEARS
51.7/ 100
METRIC RATING
173rd/ 347
METRIC RANK
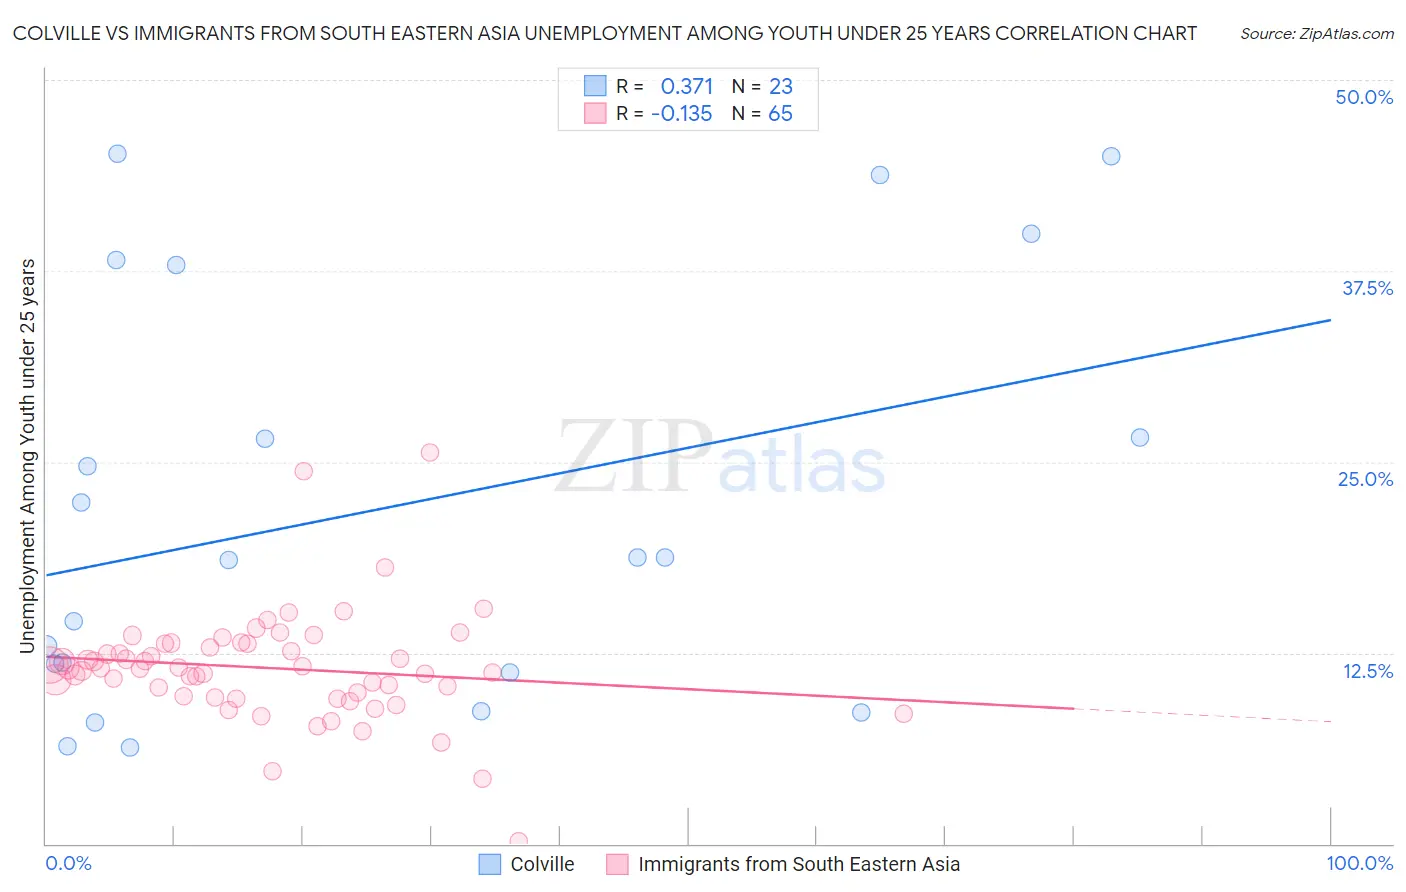
Colville vs Immigrants from South Eastern Asia Unemployment Among Youth under 25 years Correlation Chart
The statistical analysis conducted on geographies consisting of 34,625,223 people shows a mild positive correlation between the proportion of Colville and unemployment rate among youth under the age of 25 in the United States with a correlation coefficient (R) of 0.371 and weighted average of 16.8%. Similarly, the statistical analysis conducted on geographies consisting of 501,285,462 people shows a poor negative correlation between the proportion of Immigrants from South Eastern Asia and unemployment rate among youth under the age of 25 in the United States with a correlation coefficient (R) of -0.135 and weighted average of 11.6%, a difference of 44.5%.
Unemployment Among Youth under 25 years Correlation Summary
| Measurement | Colville | Immigrants from South Eastern Asia |
| Minimum | 6.3% | 0.20% |
| Maximum | 45.2% | 25.6% |
| Range | 38.9% | 25.4% |
| Mean | 22.0% | 11.5% |
| Median | 18.7% | 11.5% |
| Interquartile 25% (IQ1) | 11.2% | 9.6% |
| Interquartile 75% (IQ3) | 37.9% | 13.1% |
| Interquartile Range (IQR) | 26.7% | 3.5% |
| Standard Deviation (Sample) | 13.4% | 3.7% |
| Standard Deviation (Population) | 13.1% | 3.7% |
Similar Demographics by Unemployment Among Youth under 25 years
Demographics Similar to Colville by Unemployment Among Youth under 25 years
In terms of unemployment among youth under 25 years, the demographic groups most similar to Colville are Tsimshian (16.5%, a difference of 1.7%), Yuman (16.3%, a difference of 2.7%), Arapaho (16.3%, a difference of 3.0%), Pima (16.2%, a difference of 3.2%), and Immigrants from St. Vincent and the Grenadines (16.1%, a difference of 3.8%).
| Demographics | Rating | Rank | Unemployment Among Youth under 25 years |
| Guyanese | 0.0 /100 | #333 | Tragic 15.9% |
| Immigrants | Guyana | 0.0 /100 | #334 | Tragic 15.9% |
| Immigrants | St. Vincent and the Grenadines | 0.0 /100 | #335 | Tragic 16.1% |
| Pima | 0.0 /100 | #336 | Tragic 16.2% |
| Arapaho | 0.0 /100 | #337 | Tragic 16.3% |
| Yuman | 0.0 /100 | #338 | Tragic 16.3% |
| Tsimshian | 0.0 /100 | #339 | Tragic 16.5% |
| Colville | 0.0 /100 | #340 | Tragic 16.8% |
| Paiute | 0.0 /100 | #341 | Tragic 17.6% |
| Puerto Ricans | 0.0 /100 | #342 | Tragic 18.4% |
| Navajo | 0.0 /100 | #343 | Tragic 18.6% |
| Crow | 0.0 /100 | #344 | Tragic 20.1% |
| Hopi | 0.0 /100 | #345 | Tragic 21.5% |
| Inupiat | 0.0 /100 | #346 | Tragic 22.0% |
| Yup'ik | 0.0 /100 | #347 | Tragic 23.7% |
Demographics Similar to Immigrants from South Eastern Asia by Unemployment Among Youth under 25 years
In terms of unemployment among youth under 25 years, the demographic groups most similar to Immigrants from South Eastern Asia are Immigrants from China (11.6%, a difference of 0.070%), Immigrants from Morocco (11.6%, a difference of 0.14%), Bangladeshi (11.6%, a difference of 0.16%), Immigrants from Iraq (11.6%, a difference of 0.19%), and Russian (11.6%, a difference of 0.23%).
| Demographics | Rating | Rank | Unemployment Among Youth under 25 years |
| Spanish | 60.3 /100 | #166 | Good 11.6% |
| Okinawans | 58.7 /100 | #167 | Average 11.6% |
| Potawatomi | 57.9 /100 | #168 | Average 11.6% |
| Eastern Europeans | 57.5 /100 | #169 | Average 11.6% |
| Russians | 57.3 /100 | #170 | Average 11.6% |
| Bangladeshis | 55.6 /100 | #171 | Average 11.6% |
| Immigrants | Morocco | 55.1 /100 | #172 | Average 11.6% |
| Immigrants | South Eastern Asia | 51.7 /100 | #173 | Average 11.6% |
| Immigrants | China | 50.0 /100 | #174 | Average 11.6% |
| Immigrants | Iraq | 47.0 /100 | #175 | Average 11.6% |
| Ugandans | 45.6 /100 | #176 | Average 11.6% |
| Immigrants | Denmark | 45.0 /100 | #177 | Average 11.6% |
| Immigrants | Europe | 42.4 /100 | #178 | Average 11.6% |
| Immigrants | Hong Kong | 42.4 /100 | #179 | Average 11.6% |
| Spaniards | 39.8 /100 | #180 | Fair 11.7% |