Colville vs Immigrants from Belgium Unemployment Among Seniors over 65 years
COMPARE
Colville
Immigrants from Belgium
Unemployment Among Seniors over 65 years
Unemployment Among Seniors over 65 years Comparison
Colville
Immigrants from Belgium
5.4%
UNEMPLOYMENT AMONG SENIORS OVER 65 YEARS
0.1/ 100
METRIC RATING
278th/ 347
METRIC RANK
5.2%
UNEMPLOYMENT AMONG SENIORS OVER 65 YEARS
44.8/ 100
METRIC RATING
178th/ 347
METRIC RANK
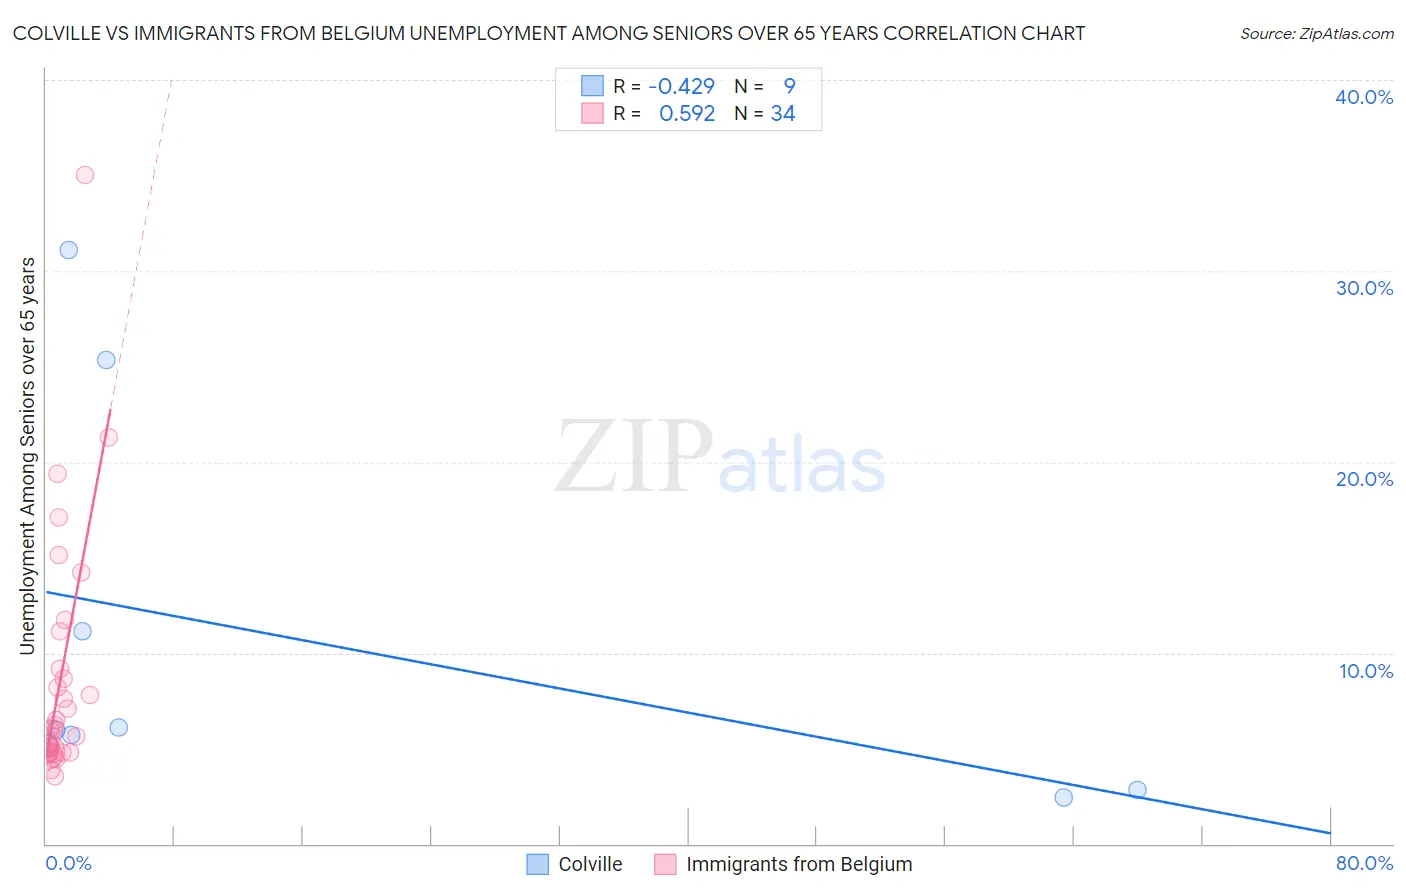
Colville vs Immigrants from Belgium Unemployment Among Seniors over 65 years Correlation Chart
The statistical analysis conducted on geographies consisting of 33,243,708 people shows a moderate negative correlation between the proportion of Colville and unemployment rate amomg seniors over the age of 65 in the United States with a correlation coefficient (R) of -0.429 and weighted average of 5.4%. Similarly, the statistical analysis conducted on geographies consisting of 140,773,385 people shows a substantial positive correlation between the proportion of Immigrants from Belgium and unemployment rate amomg seniors over the age of 65 in the United States with a correlation coefficient (R) of 0.592 and weighted average of 5.2%, a difference of 5.6%.
Unemployment Among Seniors over 65 years Correlation Summary
| Measurement | Colville | Immigrants from Belgium |
| Minimum | 2.4% | 3.5% |
| Maximum | 31.1% | 35.0% |
| Range | 28.7% | 31.5% |
| Mean | 10.6% | 8.7% |
| Median | 5.9% | 6.0% |
| Interquartile 25% (IQ1) | 4.0% | 4.8% |
| Interquartile 75% (IQ3) | 18.2% | 9.2% |
| Interquartile Range (IQR) | 14.3% | 4.4% |
| Standard Deviation (Sample) | 10.4% | 6.5% |
| Standard Deviation (Population) | 9.8% | 6.4% |
Similar Demographics by Unemployment Among Seniors over 65 years
Demographics Similar to Colville by Unemployment Among Seniors over 65 years
In terms of unemployment among seniors over 65 years, the demographic groups most similar to Colville are Immigrants from Western Africa (5.4%, a difference of 0.11%), Brazilian (5.5%, a difference of 0.12%), Pueblo (5.4%, a difference of 0.14%), Immigrants from South America (5.5%, a difference of 0.16%), and Mexican American Indian (5.4%, a difference of 0.17%).
| Demographics | Rating | Rank | Unemployment Among Seniors over 65 years |
| Cypriots | 0.1 /100 | #271 | Tragic 5.4% |
| Immigrants | Jamaica | 0.1 /100 | #272 | Tragic 5.4% |
| Immigrants | Nigeria | 0.1 /100 | #273 | Tragic 5.4% |
| Immigrants | Brazil | 0.1 /100 | #274 | Tragic 5.4% |
| Mexican American Indians | 0.1 /100 | #275 | Tragic 5.4% |
| Pueblo | 0.1 /100 | #276 | Tragic 5.4% |
| Immigrants | Western Africa | 0.1 /100 | #277 | Tragic 5.4% |
| Colville | 0.1 /100 | #278 | Tragic 5.4% |
| Brazilians | 0.1 /100 | #279 | Tragic 5.5% |
| Immigrants | South America | 0.1 /100 | #280 | Tragic 5.5% |
| Immigrants | Norway | 0.0 /100 | #281 | Tragic 5.5% |
| Immigrants | Belize | 0.0 /100 | #282 | Tragic 5.5% |
| Immigrants | Haiti | 0.0 /100 | #283 | Tragic 5.5% |
| Immigrants | Liberia | 0.0 /100 | #284 | Tragic 5.5% |
| Central Americans | 0.0 /100 | #285 | Tragic 5.5% |
Demographics Similar to Immigrants from Belgium by Unemployment Among Seniors over 65 years
In terms of unemployment among seniors over 65 years, the demographic groups most similar to Immigrants from Belgium are Immigrants from Somalia (5.2%, a difference of 0.020%), Icelander (5.2%, a difference of 0.040%), Russian (5.2%, a difference of 0.040%), Immigrants from Italy (5.2%, a difference of 0.040%), and Indian (Asian) (5.2%, a difference of 0.060%).
| Demographics | Rating | Rank | Unemployment Among Seniors over 65 years |
| Immigrants | Nonimmigrants | 54.1 /100 | #171 | Average 5.1% |
| Immigrants | Ireland | 53.2 /100 | #172 | Average 5.1% |
| Immigrants | Spain | 51.7 /100 | #173 | Average 5.1% |
| Spanish Americans | 50.0 /100 | #174 | Average 5.1% |
| Immigrants | Eastern Europe | 49.8 /100 | #175 | Average 5.1% |
| Indians (Asian) | 46.6 /100 | #176 | Average 5.2% |
| Icelanders | 45.9 /100 | #177 | Average 5.2% |
| Immigrants | Belgium | 44.8 /100 | #178 | Average 5.2% |
| Immigrants | Somalia | 44.0 /100 | #179 | Average 5.2% |
| Russians | 43.6 /100 | #180 | Average 5.2% |
| Immigrants | Italy | 43.5 /100 | #181 | Average 5.2% |
| Panamanians | 43.0 /100 | #182 | Average 5.2% |
| Immigrants | Western Asia | 42.1 /100 | #183 | Average 5.2% |
| Immigrants | Serbia | 41.6 /100 | #184 | Average 5.2% |
| Immigrants | Iran | 36.0 /100 | #185 | Fair 5.2% |