Colville vs Arab Unemployment Among Ages 65 to 74 years
COMPARE
Colville
Arab
Unemployment Among Ages 65 to 74 years
Unemployment Among Ages 65 to 74 years Comparison
Colville
Arabs
5.4%
UNEMPLOYMENT AMONG AGES 65 TO 74 YEARS
20.4/ 100
METRIC RATING
197th/ 347
METRIC RANK
5.4%
UNEMPLOYMENT AMONG AGES 65 TO 74 YEARS
46.8/ 100
METRIC RATING
177th/ 347
METRIC RANK
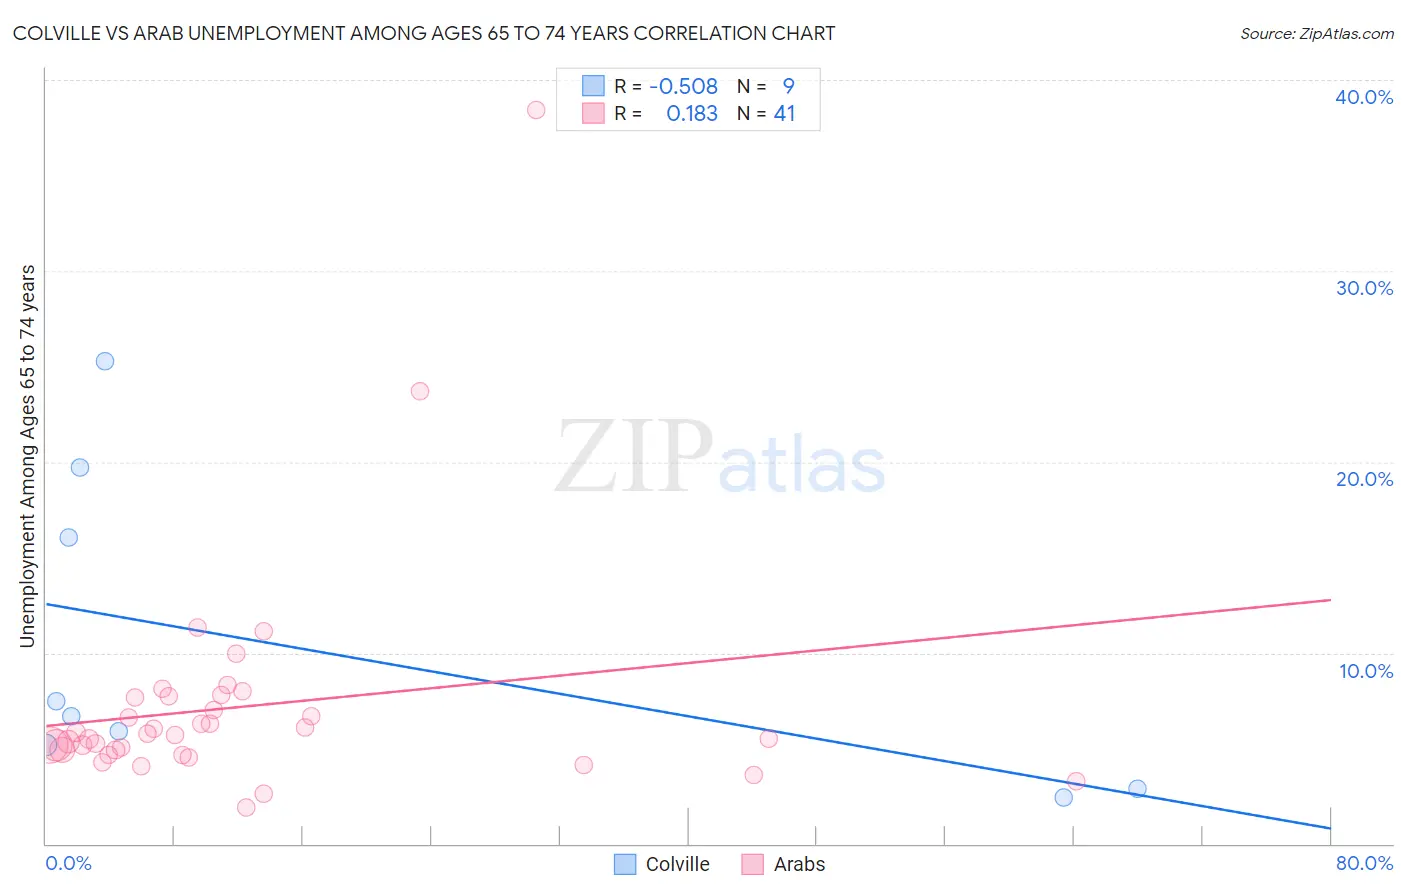
Colville vs Arab Unemployment Among Ages 65 to 74 years Correlation Chart
The statistical analysis conducted on geographies consisting of 33,027,474 people shows a substantial negative correlation between the proportion of Colville and unemployment rate among population between the ages 65 and 74 in the United States with a correlation coefficient (R) of -0.508 and weighted average of 5.4%. Similarly, the statistical analysis conducted on geographies consisting of 412,403,699 people shows a poor positive correlation between the proportion of Arabs and unemployment rate among population between the ages 65 and 74 in the United States with a correlation coefficient (R) of 0.183 and weighted average of 5.4%, a difference of 1.0%.
Unemployment Among Ages 65 to 74 years Correlation Summary
| Measurement | Colville | Arab |
| Minimum | 2.4% | 1.9% |
| Maximum | 25.3% | 38.4% |
| Range | 22.9% | 36.5% |
| Mean | 10.2% | 7.2% |
| Median | 6.7% | 5.7% |
| Interquartile 25% (IQ1) | 4.0% | 4.8% |
| Interquartile 75% (IQ3) | 17.9% | 7.7% |
| Interquartile Range (IQR) | 13.8% | 2.9% |
| Standard Deviation (Sample) | 8.1% | 6.1% |
| Standard Deviation (Population) | 7.7% | 6.0% |
Demographics Similar to Colville and Arabs by Unemployment Among Ages 65 to 74 years
In terms of unemployment among ages 65 to 74 years, the demographic groups most similar to Colville are Costa Rican (5.4%, a difference of 0.030%), Immigrants from China (5.4%, a difference of 0.18%), Immigrants from Denmark (5.4%, a difference of 0.20%), Cherokee (5.4%, a difference of 0.25%), and Basque (5.4%, a difference of 0.28%). Similarly, the demographic groups most similar to Arabs are French (5.4%, a difference of 0.12%), Guamanian/Chamorro (5.4%, a difference of 0.16%), Immigrants from Ireland (5.4%, a difference of 0.16%), Soviet Union (5.4%, a difference of 0.23%), and Spanish American (5.4%, a difference of 0.29%).
| Demographics | Rating | Rank | Unemployment Among Ages 65 to 74 years |
| Arabs | 46.8 /100 | #177 | Average 5.4% |
| French | 43.1 /100 | #178 | Average 5.4% |
| Guamanians/Chamorros | 42.1 /100 | #179 | Average 5.4% |
| Immigrants | Ireland | 42.0 /100 | #180 | Average 5.4% |
| Soviet Union | 40.0 /100 | #181 | Fair 5.4% |
| Spanish Americans | 38.2 /100 | #182 | Fair 5.4% |
| Immigrants | Spain | 37.3 /100 | #183 | Fair 5.4% |
| Immigrants | Senegal | 35.2 /100 | #184 | Fair 5.4% |
| Russians | 34.4 /100 | #185 | Fair 5.4% |
| Lithuanians | 32.4 /100 | #186 | Fair 5.4% |
| Immigrants | Nonimmigrants | 30.6 /100 | #187 | Fair 5.4% |
| Immigrants | Europe | 28.8 /100 | #188 | Fair 5.4% |
| Immigrants | Africa | 28.3 /100 | #189 | Fair 5.4% |
| Basques | 26.6 /100 | #190 | Fair 5.4% |
| Immigrants | Egypt | 26.5 /100 | #191 | Fair 5.4% |
| Maltese | 26.4 /100 | #192 | Fair 5.4% |
| Cherokee | 25.8 /100 | #193 | Fair 5.4% |
| Immigrants | Denmark | 24.7 /100 | #194 | Fair 5.4% |
| Immigrants | China | 24.2 /100 | #195 | Fair 5.4% |
| Costa Ricans | 21.1 /100 | #196 | Fair 5.4% |
| Colville | 20.4 /100 | #197 | Fair 5.4% |