Colombian vs Immigrants from Germany Unemployment Among Women with Children Under 18 years
COMPARE
Colombian
Immigrants from Germany
Unemployment Among Women with Children Under 18 years
Unemployment Among Women with Children Under 18 years Comparison
Colombians
Immigrants from Germany
5.6%
UNEMPLOYMENT AMONG WOMEN WITH CHILDREN UNDER 18 YEARS
22.8/ 100
METRIC RATING
195th/ 347
METRIC RANK
5.5%
UNEMPLOYMENT AMONG WOMEN WITH CHILDREN UNDER 18 YEARS
48.5/ 100
METRIC RATING
176th/ 347
METRIC RANK
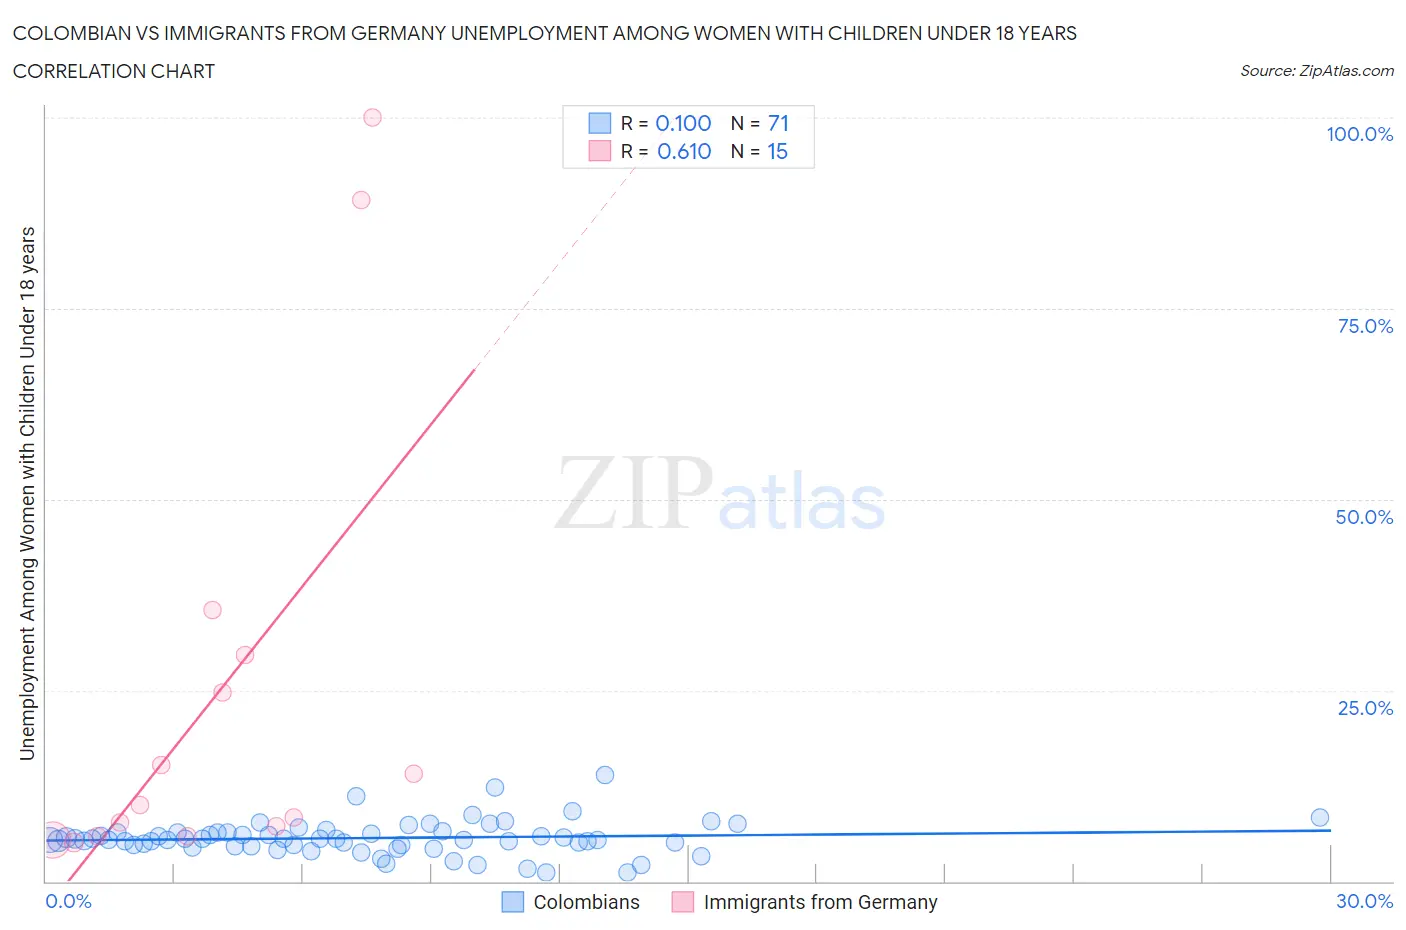
Colombian vs Immigrants from Germany Unemployment Among Women with Children Under 18 years Correlation Chart
The statistical analysis conducted on geographies consisting of 403,998,834 people shows a slight positive correlation between the proportion of Colombians and unemployment rate among women with children under the age of 18 in the United States with a correlation coefficient (R) of 0.100 and weighted average of 5.6%. Similarly, the statistical analysis conducted on geographies consisting of 438,432,777 people shows a significant positive correlation between the proportion of Immigrants from Germany and unemployment rate among women with children under the age of 18 in the United States with a correlation coefficient (R) of 0.610 and weighted average of 5.5%, a difference of 2.1%.
Unemployment Among Women with Children Under 18 years Correlation Summary
| Measurement | Colombian | Immigrants from Germany |
| Minimum | 1.1% | 5.0% |
| Maximum | 14.0% | 100.0% |
| Range | 12.9% | 95.0% |
| Mean | 5.7% | 24.2% |
| Median | 5.5% | 10.0% |
| Interquartile 25% (IQ1) | 4.7% | 5.9% |
| Interquartile 75% (IQ3) | 6.4% | 29.6% |
| Interquartile Range (IQR) | 1.7% | 23.7% |
| Standard Deviation (Sample) | 2.2% | 30.1% |
| Standard Deviation (Population) | 2.2% | 29.1% |
Demographics Similar to Colombians and Immigrants from Germany by Unemployment Among Women with Children Under 18 years
In terms of unemployment among women with children under 18 years, the demographic groups most similar to Colombians are Immigrants from Chile (5.5%, a difference of 0.58%), Immigrants from Afghanistan (5.5%, a difference of 0.59%), Immigrants from Spain (5.5%, a difference of 0.71%), South American Indian (5.5%, a difference of 0.72%), and Immigrants from Poland (5.5%, a difference of 0.75%). Similarly, the demographic groups most similar to Immigrants from Germany are Spanish (5.4%, a difference of 0.040%), Hawaiian (5.5%, a difference of 0.17%), Costa Rican (5.5%, a difference of 0.24%), Syrian (5.5%, a difference of 0.41%), and Immigrants from Southern Europe (5.5%, a difference of 0.41%).
| Demographics | Rating | Rank | Unemployment Among Women with Children Under 18 years |
| Spanish | 49.0 /100 | #175 | Average 5.4% |
| Immigrants | Germany | 48.5 /100 | #176 | Average 5.5% |
| Hawaiians | 46.1 /100 | #177 | Average 5.5% |
| Costa Ricans | 45.2 /100 | #178 | Average 5.5% |
| Syrians | 42.8 /100 | #179 | Average 5.5% |
| Immigrants | Southern Europe | 42.7 /100 | #180 | Average 5.5% |
| Immigrants | Hungary | 41.3 /100 | #181 | Average 5.5% |
| Immigrants | Sudan | 40.6 /100 | #182 | Average 5.5% |
| Immigrants | Laos | 38.8 /100 | #183 | Fair 5.5% |
| Immigrants | Cambodia | 38.4 /100 | #184 | Fair 5.5% |
| Immigrants | Zaire | 38.1 /100 | #185 | Fair 5.5% |
| Indonesians | 36.3 /100 | #186 | Fair 5.5% |
| Malaysians | 35.7 /100 | #187 | Fair 5.5% |
| Iraqis | 35.3 /100 | #188 | Fair 5.5% |
| Immigrants | Eritrea | 33.8 /100 | #189 | Fair 5.5% |
| Immigrants | Poland | 31.2 /100 | #190 | Fair 5.5% |
| South American Indians | 30.8 /100 | #191 | Fair 5.5% |
| Immigrants | Spain | 30.7 /100 | #192 | Fair 5.5% |
| Immigrants | Afghanistan | 29.3 /100 | #193 | Fair 5.5% |
| Immigrants | Chile | 29.2 /100 | #194 | Fair 5.5% |
| Colombians | 22.8 /100 | #195 | Fair 5.6% |