Colombian vs Immigrants from Argentina Unemployment Among Ages 16 to 19 years
COMPARE
Colombian
Immigrants from Argentina
Unemployment Among Ages 16 to 19 years
Unemployment Among Ages 16 to 19 years Comparison
Colombians
Immigrants from Argentina
18.3%
UNEMPLOYMENT AMONG AGES 16 TO 19 YEARS
3.7/ 100
METRIC RATING
234th/ 347
METRIC RANK
18.0%
UNEMPLOYMENT AMONG AGES 16 TO 19 YEARS
12.5/ 100
METRIC RATING
218th/ 347
METRIC RANK
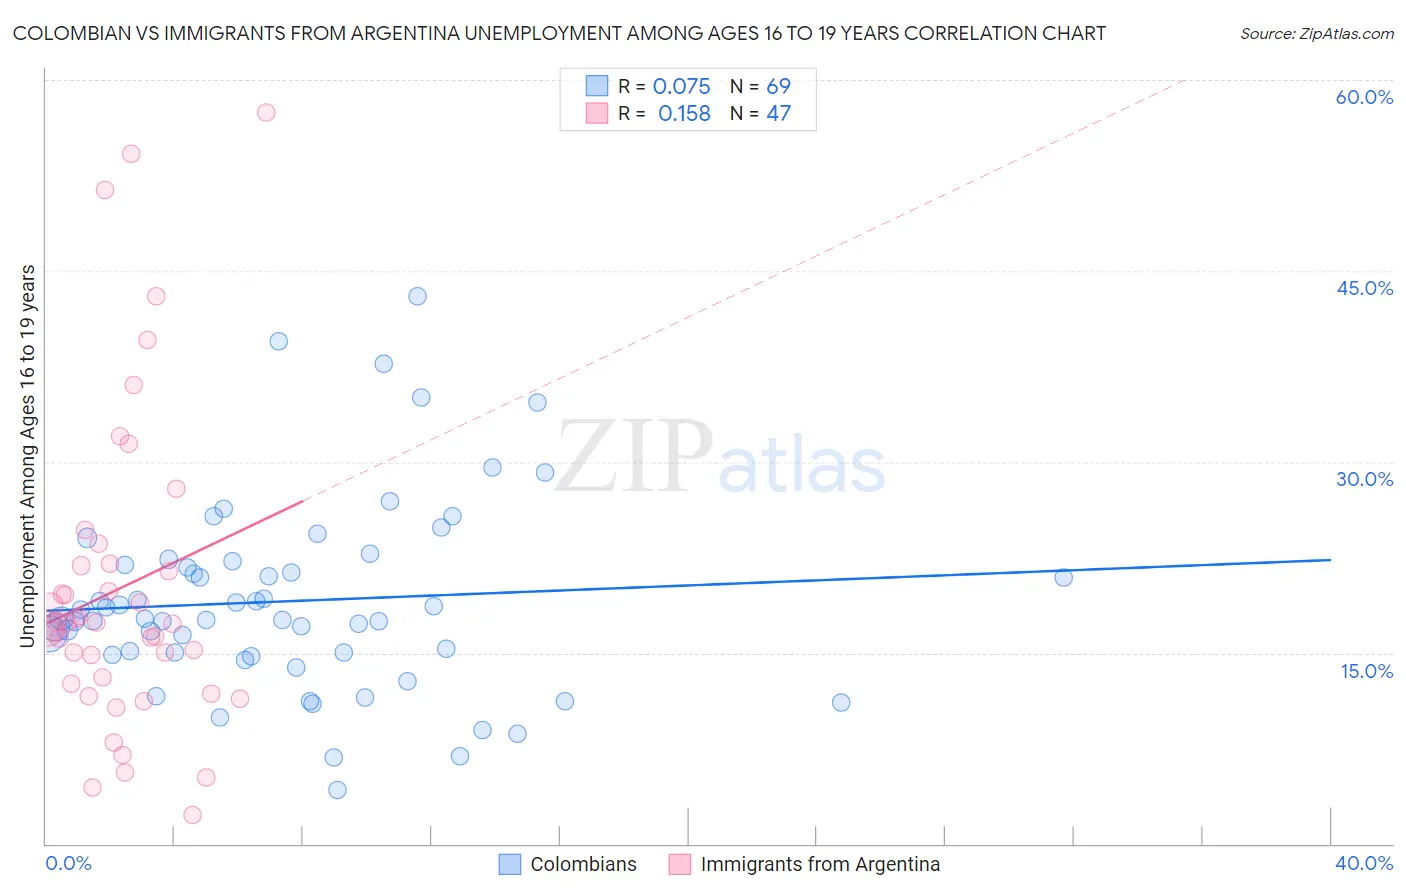
Colombian vs Immigrants from Argentina Unemployment Among Ages 16 to 19 years Correlation Chart
The statistical analysis conducted on geographies consisting of 397,781,439 people shows a slight positive correlation between the proportion of Colombians and unemployment rate among population between the ages 16 and 19 in the United States with a correlation coefficient (R) of 0.075 and weighted average of 18.3%. Similarly, the statistical analysis conducted on geographies consisting of 255,262,064 people shows a poor positive correlation between the proportion of Immigrants from Argentina and unemployment rate among population between the ages 16 and 19 in the United States with a correlation coefficient (R) of 0.158 and weighted average of 18.0%, a difference of 1.5%.
Unemployment Among Ages 16 to 19 years Correlation Summary
| Measurement | Colombian | Immigrants from Argentina |
| Minimum | 4.2% | 2.3% |
| Maximum | 43.0% | 57.4% |
| Range | 38.8% | 55.1% |
| Mean | 19.1% | 20.1% |
| Median | 17.7% | 17.3% |
| Interquartile 25% (IQ1) | 14.9% | 12.6% |
| Interquartile 75% (IQ3) | 22.0% | 22.0% |
| Interquartile Range (IQR) | 7.1% | 9.4% |
| Standard Deviation (Sample) | 7.5% | 12.4% |
| Standard Deviation (Population) | 7.5% | 12.3% |
Demographics Similar to Colombians and Immigrants from Argentina by Unemployment Among Ages 16 to 19 years
In terms of unemployment among ages 16 to 19 years, the demographic groups most similar to Colombians are Immigrants from Russia (18.2%, a difference of 0.11%), Seminole (18.2%, a difference of 0.11%), Nepalese (18.2%, a difference of 0.16%), Spanish American (18.2%, a difference of 0.29%), and French American Indian (18.3%, a difference of 0.29%). Similarly, the demographic groups most similar to Immigrants from Argentina are Immigrants from Kazakhstan (18.0%, a difference of 0.050%), South American Indian (18.0%, a difference of 0.050%), Immigrants from Africa (18.0%, a difference of 0.060%), Immigrants from Albania (18.0%, a difference of 0.12%), and Immigrants from Spain (18.0%, a difference of 0.12%).
| Demographics | Rating | Rank | Unemployment Among Ages 16 to 19 years |
| Immigrants | Kazakhstan | 13.0 /100 | #216 | Poor 18.0% |
| South American Indians | 13.0 /100 | #217 | Poor 18.0% |
| Immigrants | Argentina | 12.5 /100 | #218 | Poor 18.0% |
| Immigrants | Africa | 12.0 /100 | #219 | Poor 18.0% |
| Immigrants | Albania | 11.4 /100 | #220 | Poor 18.0% |
| Immigrants | Spain | 11.4 /100 | #221 | Poor 18.0% |
| Immigrants | Iran | 10.7 /100 | #222 | Poor 18.0% |
| Immigrants | Western Asia | 10.2 /100 | #223 | Poor 18.0% |
| Immigrants | Serbia | 8.3 /100 | #224 | Tragic 18.1% |
| Immigrants | Chile | 7.5 /100 | #225 | Tragic 18.1% |
| Immigrants | Belgium | 7.3 /100 | #226 | Tragic 18.1% |
| Immigrants | Liberia | 7.1 /100 | #227 | Tragic 18.1% |
| Immigrants | Greece | 7.1 /100 | #228 | Tragic 18.1% |
| Albanians | 5.8 /100 | #229 | Tragic 18.2% |
| Spanish Americans | 4.7 /100 | #230 | Tragic 18.2% |
| Nepalese | 4.2 /100 | #231 | Tragic 18.2% |
| Immigrants | Russia | 4.0 /100 | #232 | Tragic 18.2% |
| Seminole | 4.0 /100 | #233 | Tragic 18.2% |
| Colombians | 3.7 /100 | #234 | Tragic 18.3% |
| French American Indians | 2.9 /100 | #235 | Tragic 18.3% |
| Immigrants | Colombia | 2.7 /100 | #236 | Tragic 18.3% |