Chippewa vs Immigrants from St. Vincent and the Grenadines Unemployment Among Ages 30 to 34 years
COMPARE
Chippewa
Immigrants from St. Vincent and the Grenadines
Unemployment Among Ages 30 to 34 years
Unemployment Among Ages 30 to 34 years Comparison
Chippewa
Immigrants from St. Vincent and the Grenadines
7.8%
UNEMPLOYMENT AMONG AGES 30 TO 34 YEARS
0.0/ 100
METRIC RATING
328th/ 347
METRIC RANK
7.0%
UNEMPLOYMENT AMONG AGES 30 TO 34 YEARS
0.0/ 100
METRIC RATING
310th/ 347
METRIC RANK
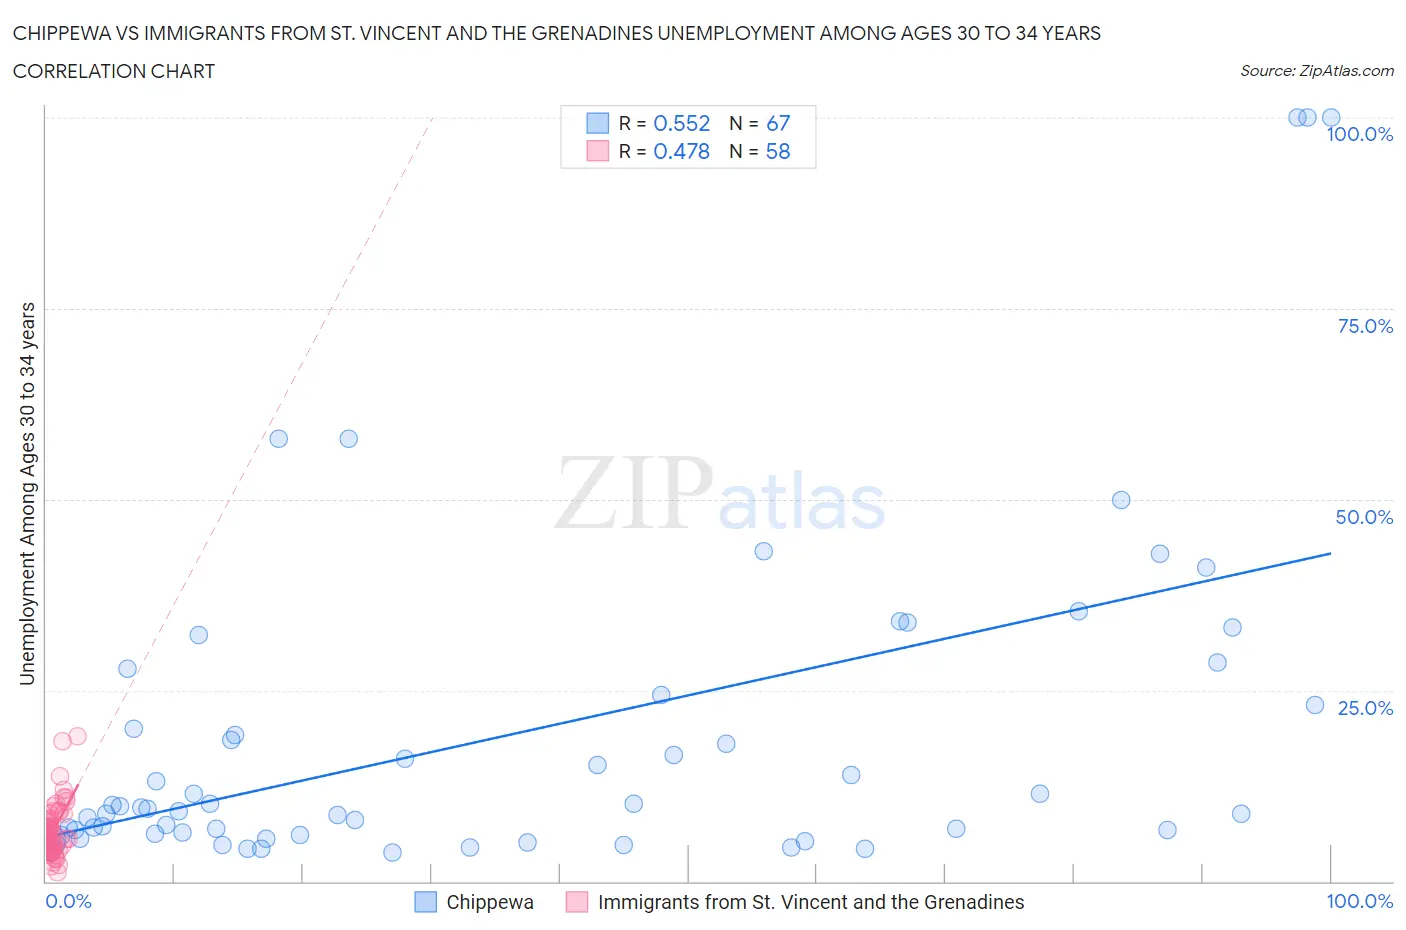
Chippewa vs Immigrants from St. Vincent and the Grenadines Unemployment Among Ages 30 to 34 years Correlation Chart
The statistical analysis conducted on geographies consisting of 205,184,240 people shows a substantial positive correlation between the proportion of Chippewa and unemployment rate among population between the ages 30 and 34 in the United States with a correlation coefficient (R) of 0.552 and weighted average of 7.8%. Similarly, the statistical analysis conducted on geographies consisting of 55,642,610 people shows a moderate positive correlation between the proportion of Immigrants from St. Vincent and the Grenadines and unemployment rate among population between the ages 30 and 34 in the United States with a correlation coefficient (R) of 0.478 and weighted average of 7.0%, a difference of 11.5%.
Unemployment Among Ages 30 to 34 years Correlation Summary
| Measurement | Chippewa | Immigrants from St. Vincent and the Grenadines |
| Minimum | 3.8% | 1.2% |
| Maximum | 100.0% | 19.0% |
| Range | 96.2% | 17.8% |
| Mean | 19.4% | 6.7% |
| Median | 9.7% | 6.3% |
| Interquartile 25% (IQ1) | 6.2% | 4.1% |
| Interquartile 75% (IQ3) | 24.4% | 8.2% |
| Interquartile Range (IQR) | 18.3% | 4.1% |
| Standard Deviation (Sample) | 22.2% | 3.5% |
| Standard Deviation (Population) | 22.1% | 3.5% |
Demographics Similar to Chippewa and Immigrants from St. Vincent and the Grenadines by Unemployment Among Ages 30 to 34 years
In terms of unemployment among ages 30 to 34 years, the demographic groups most similar to Chippewa are Immigrants from Dominican Republic (7.7%, a difference of 0.27%), Dominican (7.7%, a difference of 0.99%), Cheyenne (7.8%, a difference of 1.1%), Apache (7.3%, a difference of 5.7%), and Immigrants from Dominica (7.3%, a difference of 6.0%). Similarly, the demographic groups most similar to Immigrants from St. Vincent and the Grenadines are Immigrants from Grenada (6.9%, a difference of 0.36%), Alaskan Athabascan (7.0%, a difference of 1.1%), British West Indian (7.0%, a difference of 1.1%), Ute (7.0%, a difference of 1.2%), and Lumbee (7.1%, a difference of 1.4%).
| Demographics | Rating | Rank | Unemployment Among Ages 30 to 34 years |
| Immigrants | Grenada | 0.0 /100 | #309 | Tragic 6.9% |
| Immigrants | St. Vincent and the Grenadines | 0.0 /100 | #310 | Tragic 7.0% |
| Alaskan Athabascans | 0.0 /100 | #311 | Tragic 7.0% |
| British West Indians | 0.0 /100 | #312 | Tragic 7.0% |
| Ute | 0.0 /100 | #313 | Tragic 7.0% |
| Lumbee | 0.0 /100 | #314 | Tragic 7.1% |
| Aleuts | 0.0 /100 | #315 | Tragic 7.1% |
| Houma | 0.0 /100 | #316 | Tragic 7.2% |
| Immigrants | Cabo Verde | 0.0 /100 | #317 | Tragic 7.2% |
| Blacks/African Americans | 0.0 /100 | #318 | Tragic 7.2% |
| Guyanese | 0.0 /100 | #319 | Tragic 7.2% |
| Cape Verdeans | 0.0 /100 | #320 | Tragic 7.2% |
| Immigrants | Guyana | 0.0 /100 | #321 | Tragic 7.2% |
| Marshallese | 0.0 /100 | #322 | Tragic 7.2% |
| Immigrants | Yemen | 0.0 /100 | #323 | Tragic 7.3% |
| Immigrants | Dominica | 0.0 /100 | #324 | Tragic 7.3% |
| Apache | 0.0 /100 | #325 | Tragic 7.3% |
| Dominicans | 0.0 /100 | #326 | Tragic 7.7% |
| Immigrants | Dominican Republic | 0.0 /100 | #327 | Tragic 7.7% |
| Chippewa | 0.0 /100 | #328 | Tragic 7.8% |
| Cheyenne | 0.0 /100 | #329 | Tragic 7.8% |