Chippewa vs Immigrants from Norway Unemployment Among Ages 55 to 59 years
COMPARE
Chippewa
Immigrants from Norway
Unemployment Among Ages 55 to 59 years
Unemployment Among Ages 55 to 59 years Comparison
Chippewa
Immigrants from Norway
5.9%
UNEMPLOYMENT AMONG AGES 55 TO 59 YEARS
0.0/ 100
METRIC RATING
321st/ 347
METRIC RANK
4.8%
UNEMPLOYMENT AMONG AGES 55 TO 59 YEARS
79.8/ 100
METRIC RATING
142nd/ 347
METRIC RANK
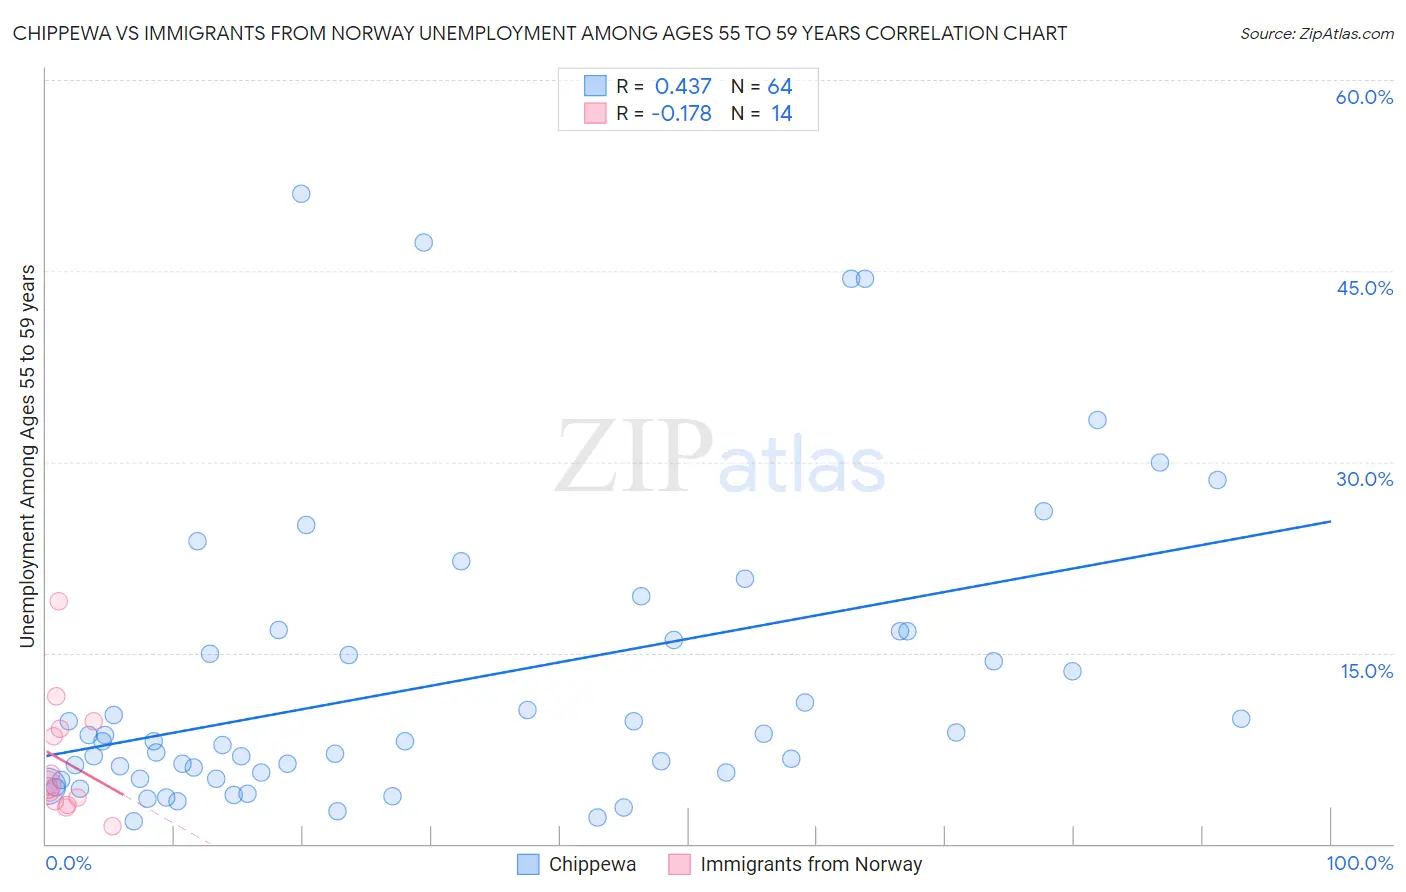
Chippewa vs Immigrants from Norway Unemployment Among Ages 55 to 59 years Correlation Chart
The statistical analysis conducted on geographies consisting of 202,372,828 people shows a moderate positive correlation between the proportion of Chippewa and unemployment rate among population between the ages 55 and 59 in the United States with a correlation coefficient (R) of 0.437 and weighted average of 5.9%. Similarly, the statistical analysis conducted on geographies consisting of 114,004,203 people shows a poor negative correlation between the proportion of Immigrants from Norway and unemployment rate among population between the ages 55 and 59 in the United States with a correlation coefficient (R) of -0.178 and weighted average of 4.8%, a difference of 23.6%.
Unemployment Among Ages 55 to 59 years Correlation Summary
| Measurement | Chippewa | Immigrants from Norway |
| Minimum | 1.7% | 1.4% |
| Maximum | 51.1% | 19.0% |
| Range | 49.4% | 17.6% |
| Mean | 12.7% | 6.5% |
| Median | 8.1% | 4.6% |
| Interquartile 25% (IQ1) | 5.3% | 3.3% |
| Interquartile 75% (IQ3) | 16.4% | 9.0% |
| Interquartile Range (IQR) | 11.0% | 5.7% |
| Standard Deviation (Sample) | 11.5% | 4.7% |
| Standard Deviation (Population) | 11.5% | 4.5% |
Similar Demographics by Unemployment Among Ages 55 to 59 years
Demographics Similar to Chippewa by Unemployment Among Ages 55 to 59 years
In terms of unemployment among ages 55 to 59 years, the demographic groups most similar to Chippewa are Crow (5.9%, a difference of 0.060%), Immigrants from Bangladesh (5.9%, a difference of 0.070%), Vietnamese (5.9%, a difference of 0.14%), Immigrants from the Azores (5.8%, a difference of 1.9%), and Immigrants from Armenia (6.0%, a difference of 1.9%).
| Demographics | Rating | Rank | Unemployment Among Ages 55 to 59 years |
| Tlingit-Haida | 0.0 /100 | #314 | Tragic 5.7% |
| Guyanese | 0.0 /100 | #315 | Tragic 5.7% |
| Immigrants | Ecuador | 0.0 /100 | #316 | Tragic 5.7% |
| Hmong | 0.0 /100 | #317 | Tragic 5.7% |
| Immigrants | Guyana | 0.0 /100 | #318 | Tragic 5.8% |
| Kiowa | 0.0 /100 | #319 | Tragic 5.8% |
| Immigrants | Azores | 0.0 /100 | #320 | Tragic 5.8% |
| Chippewa | 0.0 /100 | #321 | Tragic 5.9% |
| Crow | 0.0 /100 | #322 | Tragic 5.9% |
| Immigrants | Bangladesh | 0.0 /100 | #323 | Tragic 5.9% |
| Vietnamese | 0.0 /100 | #324 | Tragic 5.9% |
| Immigrants | Armenia | 0.0 /100 | #325 | Tragic 6.0% |
| Natives/Alaskans | 0.0 /100 | #326 | Tragic 6.0% |
| Arapaho | 0.0 /100 | #327 | Tragic 6.1% |
| Yuman | 0.0 /100 | #328 | Tragic 6.1% |
Demographics Similar to Immigrants from Norway by Unemployment Among Ages 55 to 59 years
In terms of unemployment among ages 55 to 59 years, the demographic groups most similar to Immigrants from Norway are French Canadian (4.8%, a difference of 0.020%), Immigrants from Indonesia (4.8%, a difference of 0.030%), Ukrainian (4.8%, a difference of 0.070%), Immigrants from Asia (4.8%, a difference of 0.12%), and Immigrants from Northern Europe (4.8%, a difference of 0.14%).
| Demographics | Rating | Rank | Unemployment Among Ages 55 to 59 years |
| Slavs | 83.7 /100 | #135 | Excellent 4.7% |
| Colombians | 83.6 /100 | #136 | Excellent 4.7% |
| Delaware | 83.6 /100 | #137 | Excellent 4.7% |
| Immigrants | Switzerland | 82.9 /100 | #138 | Excellent 4.7% |
| Romanians | 82.7 /100 | #139 | Excellent 4.7% |
| Immigrants | Indonesia | 80.2 /100 | #140 | Excellent 4.8% |
| French Canadians | 80.1 /100 | #141 | Excellent 4.8% |
| Immigrants | Norway | 79.8 /100 | #142 | Good 4.8% |
| Ukrainians | 78.6 /100 | #143 | Good 4.8% |
| Immigrants | Asia | 77.8 /100 | #144 | Good 4.8% |
| Immigrants | Northern Europe | 77.5 /100 | #145 | Good 4.8% |
| Immigrants | South Eastern Asia | 77.4 /100 | #146 | Good 4.8% |
| Immigrants | Singapore | 76.6 /100 | #147 | Good 4.8% |
| Immigrants | Bahamas | 71.8 /100 | #148 | Good 4.8% |
| Immigrants | Lithuania | 70.8 /100 | #149 | Good 4.8% |