Chippewa vs Basque Unemployment Among Ages 45 to 54 years
COMPARE
Chippewa
Basque
Unemployment Among Ages 45 to 54 years
Unemployment Among Ages 45 to 54 years Comparison
Chippewa
Basques
5.5%
UNEMPLOYMENT AMONG AGES 45 TO 54 YEARS
0.0/ 100
METRIC RATING
311th/ 347
METRIC RANK
4.2%
UNEMPLOYMENT AMONG AGES 45 TO 54 YEARS
99.6/ 100
METRIC RATING
50th/ 347
METRIC RANK
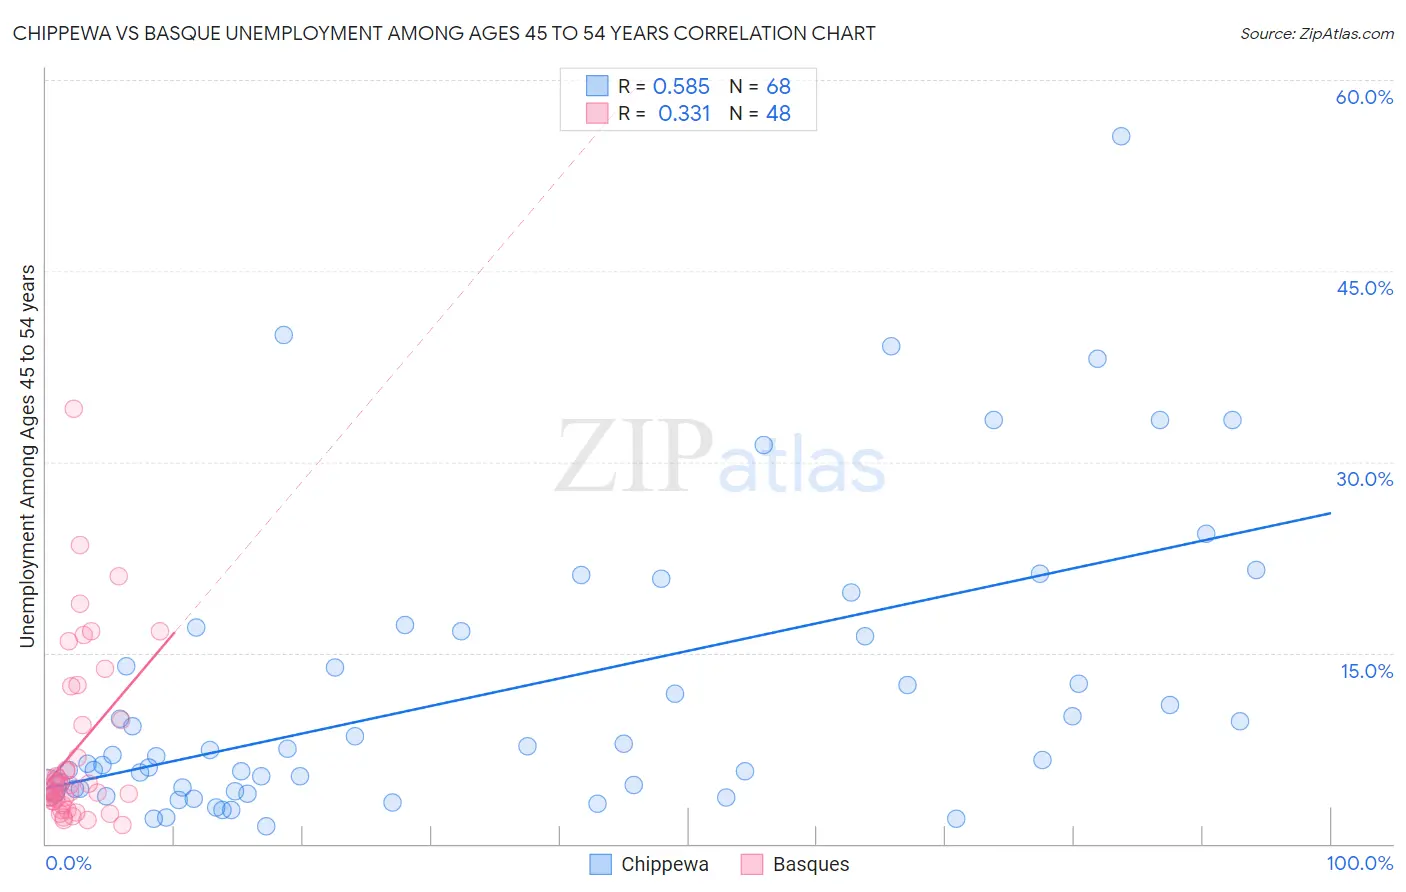
Chippewa vs Basque Unemployment Among Ages 45 to 54 years Correlation Chart
The statistical analysis conducted on geographies consisting of 209,787,831 people shows a substantial positive correlation between the proportion of Chippewa and unemployment rate among population between the ages 45 and 54 in the United States with a correlation coefficient (R) of 0.585 and weighted average of 5.5%. Similarly, the statistical analysis conducted on geographies consisting of 164,045,890 people shows a mild positive correlation between the proportion of Basques and unemployment rate among population between the ages 45 and 54 in the United States with a correlation coefficient (R) of 0.331 and weighted average of 4.2%, a difference of 29.6%.
Unemployment Among Ages 45 to 54 years Correlation Summary
| Measurement | Chippewa | Basque |
| Minimum | 1.4% | 1.5% |
| Maximum | 55.6% | 34.2% |
| Range | 54.2% | 32.7% |
| Mean | 11.9% | 7.3% |
| Median | 6.9% | 4.4% |
| Interquartile 25% (IQ1) | 4.3% | 3.4% |
| Interquartile 75% (IQ3) | 16.5% | 9.5% |
| Interquartile Range (IQR) | 12.2% | 6.1% |
| Standard Deviation (Sample) | 11.4% | 6.9% |
| Standard Deviation (Population) | 11.3% | 6.8% |
Similar Demographics by Unemployment Among Ages 45 to 54 years
Demographics Similar to Chippewa by Unemployment Among Ages 45 to 54 years
In terms of unemployment among ages 45 to 54 years, the demographic groups most similar to Chippewa are Immigrants from Barbados (5.5%, a difference of 0.28%), Barbadian (5.5%, a difference of 0.44%), Black/African American (5.4%, a difference of 1.1%), Immigrants from Grenada (5.6%, a difference of 1.8%), and Vietnamese (5.4%, a difference of 1.8%).
| Demographics | Rating | Rank | Unemployment Among Ages 45 to 54 years |
| Immigrants | Jamaica | 0.0 /100 | #304 | Tragic 5.4% |
| Immigrants | West Indies | 0.0 /100 | #305 | Tragic 5.4% |
| Immigrants | Bangladesh | 0.0 /100 | #306 | Tragic 5.4% |
| Vietnamese | 0.0 /100 | #307 | Tragic 5.4% |
| Blacks/African Americans | 0.0 /100 | #308 | Tragic 5.4% |
| Barbadians | 0.0 /100 | #309 | Tragic 5.5% |
| Immigrants | Barbados | 0.0 /100 | #310 | Tragic 5.5% |
| Chippewa | 0.0 /100 | #311 | Tragic 5.5% |
| Immigrants | Grenada | 0.0 /100 | #312 | Tragic 5.6% |
| Shoshone | 0.0 /100 | #313 | Tragic 5.6% |
| Guyanese | 0.0 /100 | #314 | Tragic 5.6% |
| Immigrants | Dominica | 0.0 /100 | #315 | Tragic 5.6% |
| Immigrants | Guyana | 0.0 /100 | #316 | Tragic 5.6% |
| Houma | 0.0 /100 | #317 | Tragic 5.6% |
| British West Indians | 0.0 /100 | #318 | Tragic 5.7% |
Demographics Similar to Basques by Unemployment Among Ages 45 to 54 years
In terms of unemployment among ages 45 to 54 years, the demographic groups most similar to Basques are Immigrants from Zimbabwe (4.2%, a difference of 0.010%), Burmese (4.2%, a difference of 0.010%), Finnish (4.2%, a difference of 0.040%), Filipino (4.2%, a difference of 0.12%), and Luxembourger (4.2%, a difference of 0.13%).
| Demographics | Rating | Rank | Unemployment Among Ages 45 to 54 years |
| Zimbabweans | 99.8 /100 | #43 | Exceptional 4.2% |
| Immigrants | Singapore | 99.7 /100 | #44 | Exceptional 4.2% |
| Immigrants | Bulgaria | 99.7 /100 | #45 | Exceptional 4.2% |
| Luxembourgers | 99.6 /100 | #46 | Exceptional 4.2% |
| Filipinos | 99.6 /100 | #47 | Exceptional 4.2% |
| Finns | 99.6 /100 | #48 | Exceptional 4.2% |
| Immigrants | Zimbabwe | 99.6 /100 | #49 | Exceptional 4.2% |
| Basques | 99.6 /100 | #50 | Exceptional 4.2% |
| Burmese | 99.6 /100 | #51 | Exceptional 4.2% |
| Poles | 99.5 /100 | #52 | Exceptional 4.2% |
| Irish | 99.5 /100 | #53 | Exceptional 4.2% |
| Chickasaw | 99.5 /100 | #54 | Exceptional 4.2% |
| Latvians | 99.4 /100 | #55 | Exceptional 4.2% |
| Immigrants | Jordan | 99.3 /100 | #56 | Exceptional 4.3% |
| Immigrants | Sri Lanka | 99.3 /100 | #57 | Exceptional 4.3% |