Chinese vs Laotian Unemployment Among Ages 35 to 44 years
COMPARE
Chinese
Laotian
Unemployment Among Ages 35 to 44 years
Unemployment Among Ages 35 to 44 years Comparison
Chinese
Laotians
4.3%
UNEMPLOYMENT AMONG AGES 35 TO 44 YEARS
99.1/ 100
METRIC RATING
32nd/ 347
METRIC RANK
4.6%
UNEMPLOYMENT AMONG AGES 35 TO 44 YEARS
80.1/ 100
METRIC RATING
134th/ 347
METRIC RANK
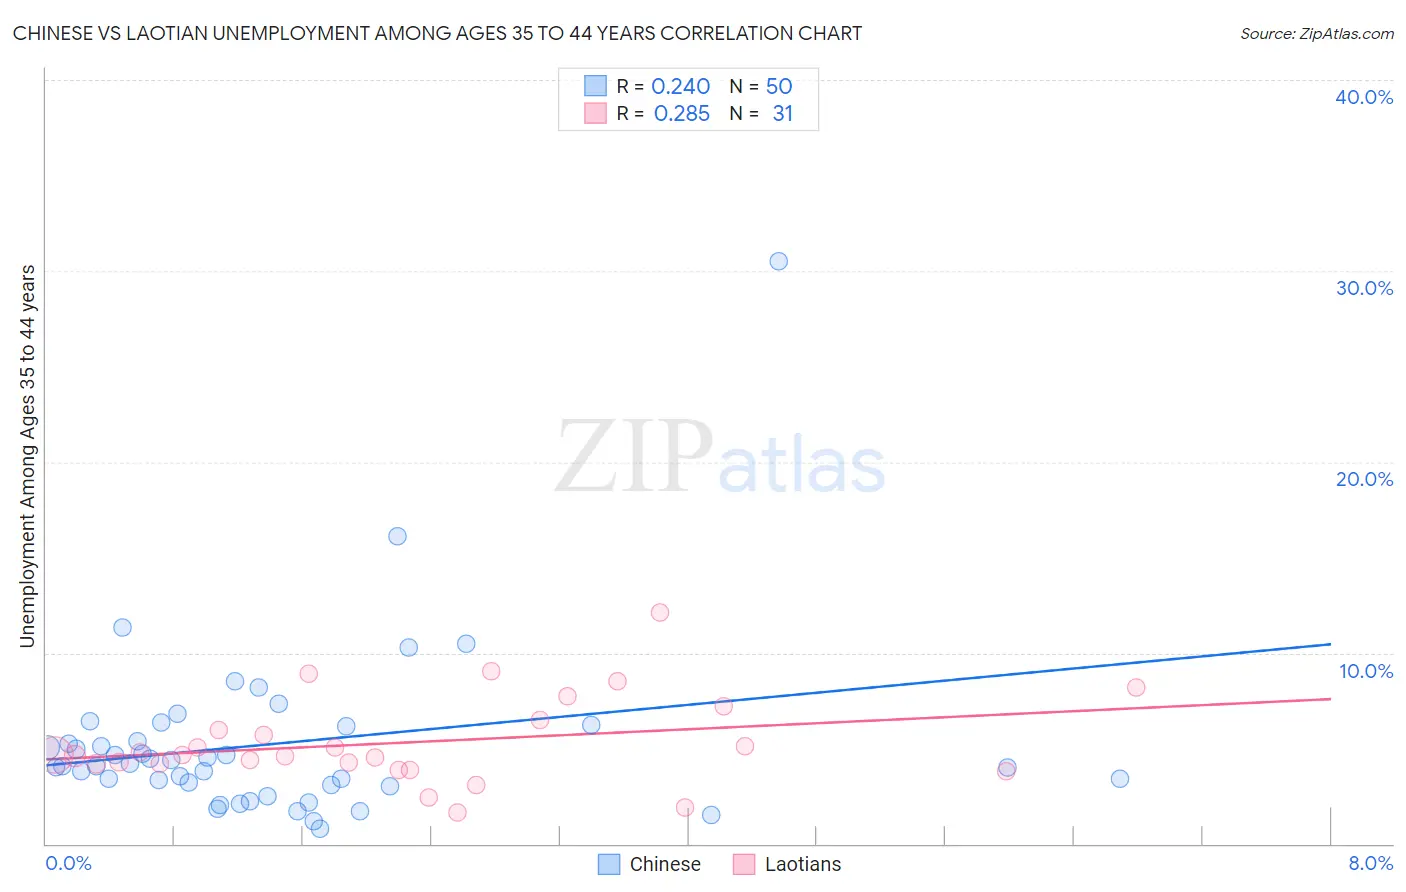
Chinese vs Laotian Unemployment Among Ages 35 to 44 years Correlation Chart
The statistical analysis conducted on geographies consisting of 64,522,420 people shows a weak positive correlation between the proportion of Chinese and unemployment rate among population between the ages 35 and 44 in the United States with a correlation coefficient (R) of 0.240 and weighted average of 4.3%. Similarly, the statistical analysis conducted on geographies consisting of 222,731,722 people shows a weak positive correlation between the proportion of Laotians and unemployment rate among population between the ages 35 and 44 in the United States with a correlation coefficient (R) of 0.285 and weighted average of 4.6%, a difference of 6.4%.
Unemployment Among Ages 35 to 44 years Correlation Summary
| Measurement | Chinese | Laotian |
| Minimum | 0.80% | 1.6% |
| Maximum | 30.5% | 12.1% |
| Range | 29.7% | 10.5% |
| Mean | 5.2% | 5.3% |
| Median | 4.1% | 4.6% |
| Interquartile 25% (IQ1) | 3.1% | 4.2% |
| Interquartile 75% (IQ3) | 6.2% | 6.5% |
| Interquartile Range (IQR) | 3.1% | 2.3% |
| Standard Deviation (Sample) | 4.6% | 2.3% |
| Standard Deviation (Population) | 4.6% | 2.2% |
Similar Demographics by Unemployment Among Ages 35 to 44 years
Demographics Similar to Chinese by Unemployment Among Ages 35 to 44 years
In terms of unemployment among ages 35 to 44 years, the demographic groups most similar to Chinese are Carpatho Rusyn (4.3%, a difference of 0.10%), Immigrants from Sri Lanka (4.3%, a difference of 0.11%), Immigrants from Pakistan (4.3%, a difference of 0.14%), European (4.3%, a difference of 0.20%), and Jordanian (4.3%, a difference of 0.26%).
| Demographics | Rating | Rank | Unemployment Among Ages 35 to 44 years |
| Bulgarians | 99.3 /100 | #25 | Exceptional 4.3% |
| Turks | 99.3 /100 | #26 | Exceptional 4.3% |
| Assyrians/Chaldeans/Syriacs | 99.3 /100 | #27 | Exceptional 4.3% |
| Immigrants | Japan | 99.3 /100 | #28 | Exceptional 4.3% |
| Europeans | 99.2 /100 | #29 | Exceptional 4.3% |
| Immigrants | Pakistan | 99.2 /100 | #30 | Exceptional 4.3% |
| Carpatho Rusyns | 99.2 /100 | #31 | Exceptional 4.3% |
| Chinese | 99.1 /100 | #32 | Exceptional 4.3% |
| Immigrants | Sri Lanka | 99.1 /100 | #33 | Exceptional 4.3% |
| Jordanians | 99.0 /100 | #34 | Exceptional 4.3% |
| Luxembourgers | 99.0 /100 | #35 | Exceptional 4.3% |
| Mongolians | 98.9 /100 | #36 | Exceptional 4.3% |
| Immigrants | Zimbabwe | 98.9 /100 | #37 | Exceptional 4.3% |
| Burmese | 98.9 /100 | #38 | Exceptional 4.3% |
| Palestinians | 98.8 /100 | #39 | Exceptional 4.3% |
Demographics Similar to Laotians by Unemployment Among Ages 35 to 44 years
In terms of unemployment among ages 35 to 44 years, the demographic groups most similar to Laotians are Syrian (4.6%, a difference of 0.070%), Colombian (4.6%, a difference of 0.080%), Immigrants from Europe (4.6%, a difference of 0.080%), Scotch-Irish (4.6%, a difference of 0.090%), and Immigrants from Iraq (4.6%, a difference of 0.13%).
| Demographics | Rating | Rank | Unemployment Among Ages 35 to 44 years |
| Immigrants | Ethiopia | 84.7 /100 | #127 | Excellent 4.5% |
| Czechoslovakians | 83.4 /100 | #128 | Excellent 4.6% |
| Immigrants | Croatia | 83.1 /100 | #129 | Excellent 4.6% |
| Immigrants | Eritrea | 82.8 /100 | #130 | Excellent 4.6% |
| Immigrants | Colombia | 82.6 /100 | #131 | Excellent 4.6% |
| Colombians | 80.8 /100 | #132 | Excellent 4.6% |
| Syrians | 80.7 /100 | #133 | Excellent 4.6% |
| Laotians | 80.1 /100 | #134 | Excellent 4.6% |
| Immigrants | Europe | 79.4 /100 | #135 | Good 4.6% |
| Scotch-Irish | 79.3 /100 | #136 | Good 4.6% |
| Immigrants | Iraq | 78.9 /100 | #137 | Good 4.6% |
| Immigrants | Norway | 77.5 /100 | #138 | Good 4.6% |
| Immigrants | Hungary | 76.3 /100 | #139 | Good 4.6% |
| Immigrants | Eastern Africa | 76.0 /100 | #140 | Good 4.6% |
| Canadians | 75.9 /100 | #141 | Good 4.6% |