Chilean vs Spaniard Unemployment Among Ages 35 to 44 years
COMPARE
Chilean
Spaniard
Unemployment Among Ages 35 to 44 years
Unemployment Among Ages 35 to 44 years Comparison
Chileans
Spaniards
4.4%
UNEMPLOYMENT AMONG AGES 35 TO 44 YEARS
97.3/ 100
METRIC RATING
56th/ 347
METRIC RANK
4.8%
UNEMPLOYMENT AMONG AGES 35 TO 44 YEARS
18.7/ 100
METRIC RATING
205th/ 347
METRIC RANK
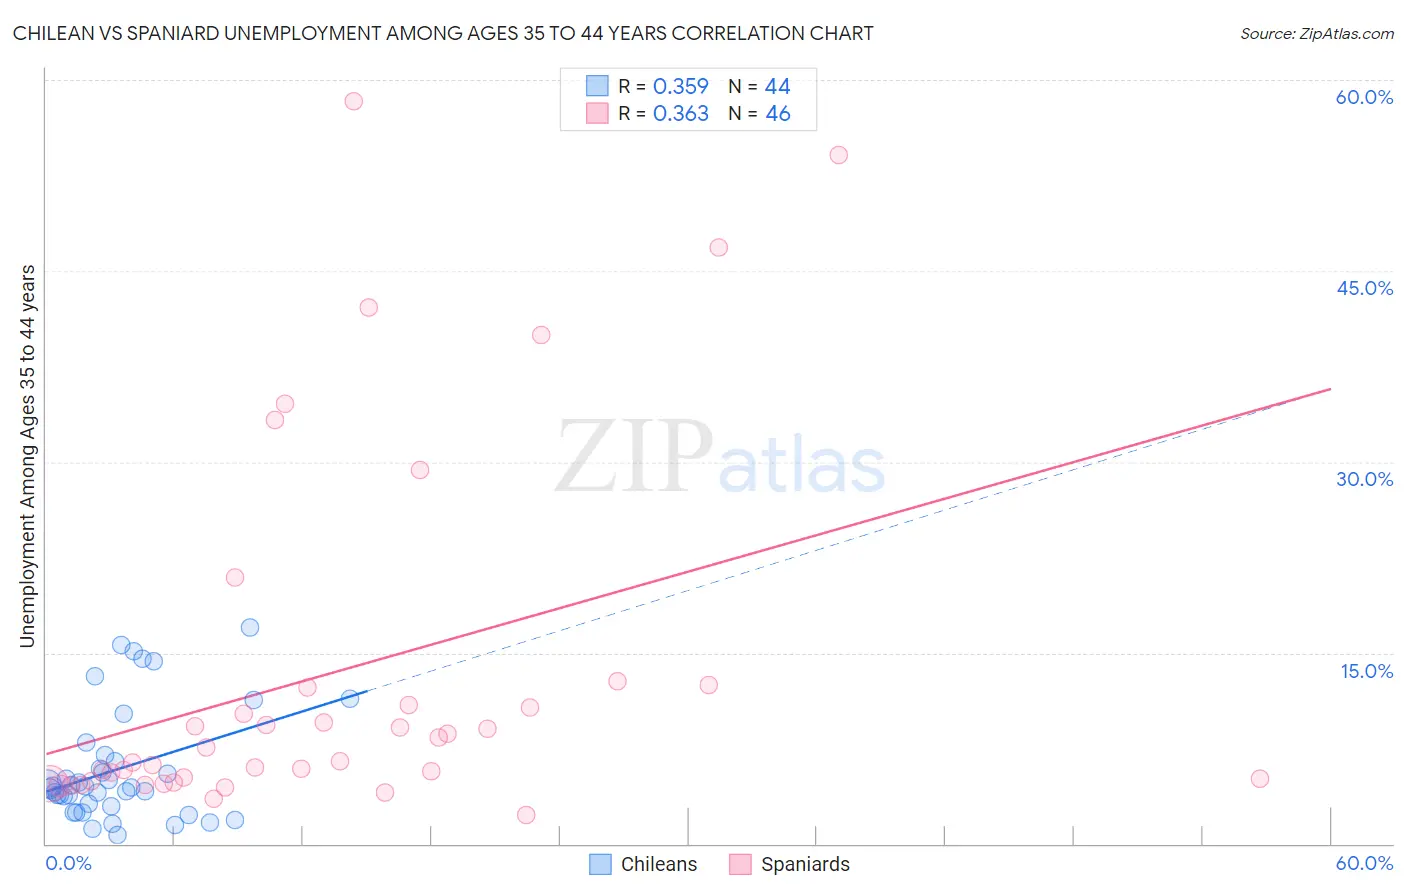
Chilean vs Spaniard Unemployment Among Ages 35 to 44 years Correlation Chart
The statistical analysis conducted on geographies consisting of 253,918,928 people shows a mild positive correlation between the proportion of Chileans and unemployment rate among population between the ages 35 and 44 in the United States with a correlation coefficient (R) of 0.359 and weighted average of 4.4%. Similarly, the statistical analysis conducted on geographies consisting of 431,052,510 people shows a mild positive correlation between the proportion of Spaniards and unemployment rate among population between the ages 35 and 44 in the United States with a correlation coefficient (R) of 0.363 and weighted average of 4.8%, a difference of 9.6%.
Unemployment Among Ages 35 to 44 years Correlation Summary
| Measurement | Chilean | Spaniard |
| Minimum | 0.70% | 2.3% |
| Maximum | 17.0% | 58.3% |
| Range | 16.3% | 56.0% |
| Mean | 5.9% | 13.4% |
| Median | 4.4% | 7.0% |
| Interquartile 25% (IQ1) | 3.1% | 4.9% |
| Interquartile 75% (IQ3) | 6.7% | 12.2% |
| Interquartile Range (IQR) | 3.6% | 7.3% |
| Standard Deviation (Sample) | 4.4% | 14.4% |
| Standard Deviation (Population) | 4.3% | 14.2% |
Similar Demographics by Unemployment Among Ages 35 to 44 years
Demographics Similar to Chileans by Unemployment Among Ages 35 to 44 years
In terms of unemployment among ages 35 to 44 years, the demographic groups most similar to Chileans are Immigrants from Moldova (4.4%, a difference of 0.020%), Asian (4.4%, a difference of 0.050%), Immigrants from Hong Kong (4.4%, a difference of 0.080%), English (4.4%, a difference of 0.10%), and Greek (4.4%, a difference of 0.11%).
| Demographics | Rating | Rank | Unemployment Among Ages 35 to 44 years |
| Swiss | 98.2 /100 | #49 | Exceptional 4.4% |
| Immigrants | Turkey | 97.8 /100 | #50 | Exceptional 4.4% |
| Immigrants | Eastern Asia | 97.8 /100 | #51 | Exceptional 4.4% |
| Okinawans | 97.7 /100 | #52 | Exceptional 4.4% |
| Immigrants | Argentina | 97.6 /100 | #53 | Exceptional 4.4% |
| Asians | 97.4 /100 | #54 | Exceptional 4.4% |
| Immigrants | Moldova | 97.3 /100 | #55 | Exceptional 4.4% |
| Chileans | 97.3 /100 | #56 | Exceptional 4.4% |
| Immigrants | Hong Kong | 97.2 /100 | #57 | Exceptional 4.4% |
| English | 97.2 /100 | #58 | Exceptional 4.4% |
| Greeks | 97.1 /100 | #59 | Exceptional 4.4% |
| Taiwanese | 97.1 /100 | #60 | Exceptional 4.4% |
| Croatians | 97.1 /100 | #61 | Exceptional 4.4% |
| Immigrants | Bulgaria | 97.1 /100 | #62 | Exceptional 4.4% |
| Austrians | 97.1 /100 | #63 | Exceptional 4.4% |
Demographics Similar to Spaniards by Unemployment Among Ages 35 to 44 years
In terms of unemployment among ages 35 to 44 years, the demographic groups most similar to Spaniards are Soviet Union (4.8%, a difference of 0.040%), Immigrants from Philippines (4.8%, a difference of 0.12%), Uruguayan (4.8%, a difference of 0.14%), Immigrants from Afghanistan (4.8%, a difference of 0.17%), and Immigrants from Western Asia (4.8%, a difference of 0.25%).
| Demographics | Rating | Rank | Unemployment Among Ages 35 to 44 years |
| Immigrants | Thailand | 22.9 /100 | #198 | Fair 4.8% |
| Immigrants | Middle Africa | 21.9 /100 | #199 | Fair 4.8% |
| Immigrants | Ukraine | 21.4 /100 | #200 | Fair 4.8% |
| Ugandans | 21.4 /100 | #201 | Fair 4.8% |
| Immigrants | Afghanistan | 20.2 /100 | #202 | Fair 4.8% |
| Uruguayans | 20.0 /100 | #203 | Fair 4.8% |
| Immigrants | Philippines | 19.8 /100 | #204 | Poor 4.8% |
| Spaniards | 18.7 /100 | #205 | Poor 4.8% |
| Soviet Union | 18.4 /100 | #206 | Poor 4.8% |
| Immigrants | Western Asia | 16.6 /100 | #207 | Poor 4.8% |
| French Canadians | 16.5 /100 | #208 | Poor 4.8% |
| Immigrants | Uruguay | 11.5 /100 | #209 | Poor 4.9% |
| Immigrants | Cameroon | 11.4 /100 | #210 | Poor 4.9% |
| Immigrants | Nonimmigrants | 9.4 /100 | #211 | Tragic 4.9% |
| Fijians | 8.7 /100 | #212 | Tragic 4.9% |