Chilean vs Immigrants from Dominican Republic Female Unemployment
COMPARE
Chilean
Immigrants from Dominican Republic
Female Unemployment
Female Unemployment Comparison
Chileans
Immigrants from Dominican Republic
5.1%
FEMALE UNEMPLOYMENT
85.8/ 100
METRIC RATING
128th/ 347
METRIC RANK
7.2%
FEMALE UNEMPLOYMENT
0.0/ 100
METRIC RATING
336th/ 347
METRIC RANK
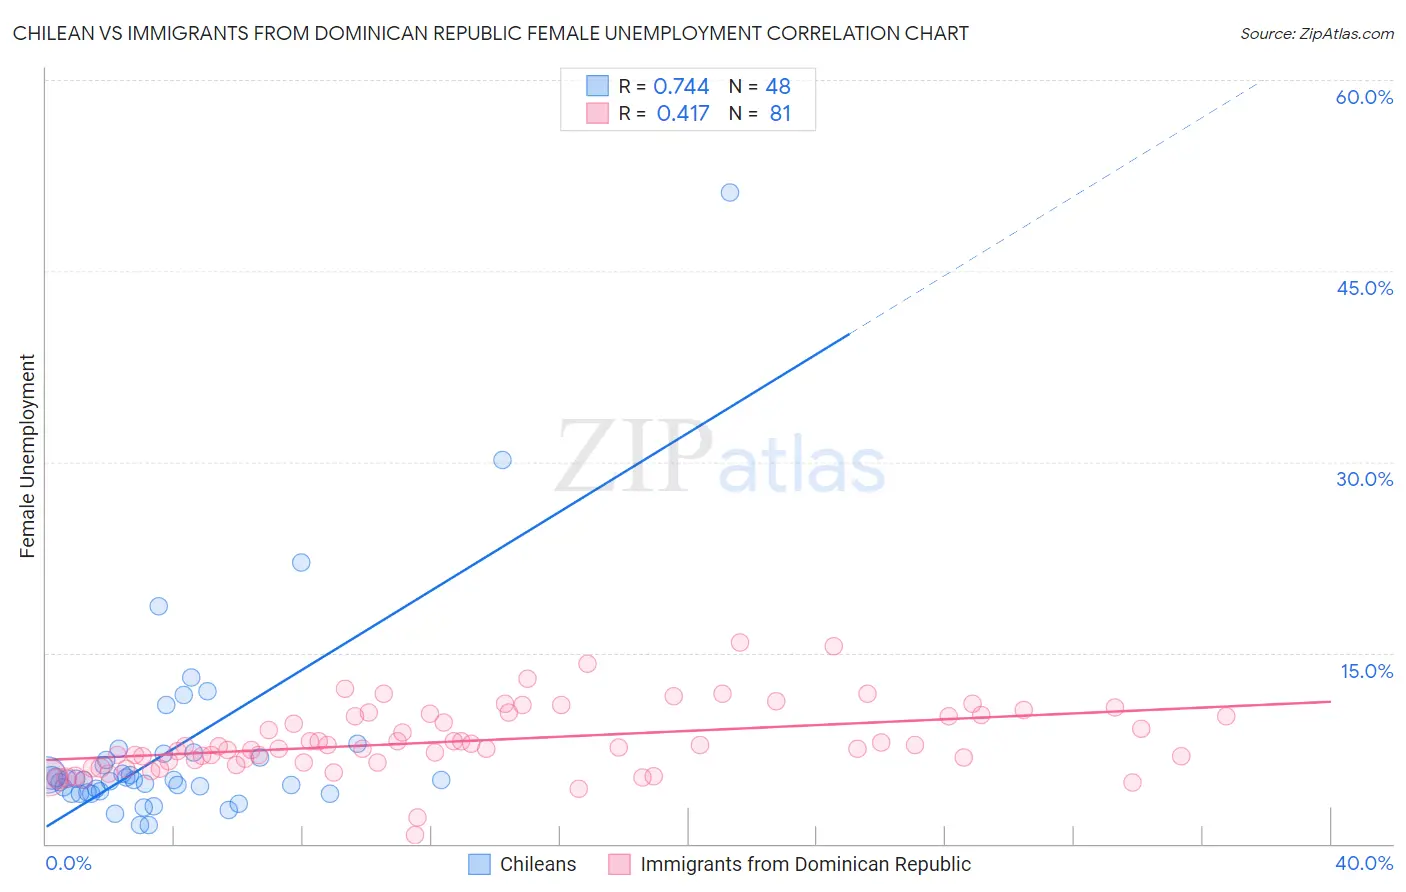
Chilean vs Immigrants from Dominican Republic Female Unemployment Correlation Chart
The statistical analysis conducted on geographies consisting of 256,253,866 people shows a strong positive correlation between the proportion of Chileans and unemploymnet rate among females in the United States with a correlation coefficient (R) of 0.744 and weighted average of 5.1%. Similarly, the statistical analysis conducted on geographies consisting of 274,282,461 people shows a moderate positive correlation between the proportion of Immigrants from Dominican Republic and unemploymnet rate among females in the United States with a correlation coefficient (R) of 0.417 and weighted average of 7.2%, a difference of 41.1%.
Female Unemployment Correlation Summary
| Measurement | Chilean | Immigrants from Dominican Republic |
| Minimum | 1.5% | 0.70% |
| Maximum | 51.2% | 15.8% |
| Range | 49.7% | 15.1% |
| Mean | 7.5% | 8.1% |
| Median | 5.0% | 7.6% |
| Interquartile 25% (IQ1) | 4.1% | 6.4% |
| Interquartile 75% (IQ3) | 6.9% | 10.1% |
| Interquartile Range (IQR) | 2.8% | 3.7% |
| Standard Deviation (Sample) | 8.3% | 2.7% |
| Standard Deviation (Population) | 8.2% | 2.7% |
Similar Demographics by Female Unemployment
Demographics Similar to Chileans by Female Unemployment
In terms of female unemployment, the demographic groups most similar to Chileans are Ethiopian (5.1%, a difference of 0.010%), Immigrants from Hungary (5.1%, a difference of 0.030%), Maltese (5.1%, a difference of 0.040%), Immigrants from Ethiopia (5.1%, a difference of 0.060%), and Immigrants from Korea (5.1%, a difference of 0.070%).
| Demographics | Rating | Rank | Female Unemployment |
| Immigrants | Western Europe | 88.1 /100 | #121 | Excellent 5.1% |
| Immigrants | Germany | 87.6 /100 | #122 | Excellent 5.1% |
| Immigrants | South Africa | 87.6 /100 | #123 | Excellent 5.1% |
| Immigrants | Europe | 87.2 /100 | #124 | Excellent 5.1% |
| Basques | 86.5 /100 | #125 | Excellent 5.1% |
| Immigrants | Korea | 86.3 /100 | #126 | Excellent 5.1% |
| Immigrants | Hungary | 86.0 /100 | #127 | Excellent 5.1% |
| Chileans | 85.8 /100 | #128 | Excellent 5.1% |
| Ethiopians | 85.7 /100 | #129 | Excellent 5.1% |
| Maltese | 85.5 /100 | #130 | Excellent 5.1% |
| Immigrants | Ethiopia | 85.4 /100 | #131 | Excellent 5.1% |
| Immigrants | Sri Lanka | 85.0 /100 | #132 | Excellent 5.1% |
| Immigrants | Hong Kong | 84.8 /100 | #133 | Excellent 5.1% |
| Immigrants | Eritrea | 84.6 /100 | #134 | Excellent 5.1% |
| Immigrants | Latvia | 84.6 /100 | #135 | Excellent 5.1% |
Demographics Similar to Immigrants from Dominican Republic by Female Unemployment
In terms of female unemployment, the demographic groups most similar to Immigrants from Dominican Republic are Dominican (7.2%, a difference of 0.64%), Navajo (7.3%, a difference of 0.94%), Immigrants from Armenia (7.1%, a difference of 2.1%), Menominee (7.0%, a difference of 2.5%), and Sioux (7.0%, a difference of 2.5%).
| Demographics | Rating | Rank | Female Unemployment |
| Immigrants | Guyana | 0.0 /100 | #329 | Tragic 6.7% |
| Yakama | 0.0 /100 | #330 | Tragic 6.7% |
| Paiute | 0.0 /100 | #331 | Tragic 6.8% |
| Sioux | 0.0 /100 | #332 | Tragic 7.0% |
| Menominee | 0.0 /100 | #333 | Tragic 7.0% |
| Immigrants | Armenia | 0.0 /100 | #334 | Tragic 7.1% |
| Dominicans | 0.0 /100 | #335 | Tragic 7.2% |
| Immigrants | Dominican Republic | 0.0 /100 | #336 | Tragic 7.2% |
| Navajo | 0.0 /100 | #337 | Tragic 7.3% |
| Tohono O'odham | 0.0 /100 | #338 | Tragic 7.7% |
| Immigrants | Yemen | 0.0 /100 | #339 | Tragic 7.8% |
| Hopi | 0.0 /100 | #340 | Tragic 8.1% |
| Inupiat | 0.0 /100 | #341 | Tragic 8.2% |
| Puerto Ricans | 0.0 /100 | #342 | Tragic 8.3% |
| Arapaho | 0.0 /100 | #343 | Tragic 8.8% |