Central American vs Israeli Unemployment Among Ages 45 to 54 years
COMPARE
Central American
Israeli
Unemployment Among Ages 45 to 54 years
Unemployment Among Ages 45 to 54 years Comparison
Central Americans
Israelis
4.8%
UNEMPLOYMENT AMONG AGES 45 TO 54 YEARS
1.3/ 100
METRIC RATING
242nd/ 347
METRIC RANK
4.8%
UNEMPLOYMENT AMONG AGES 45 TO 54 YEARS
0.9/ 100
METRIC RATING
247th/ 347
METRIC RANK
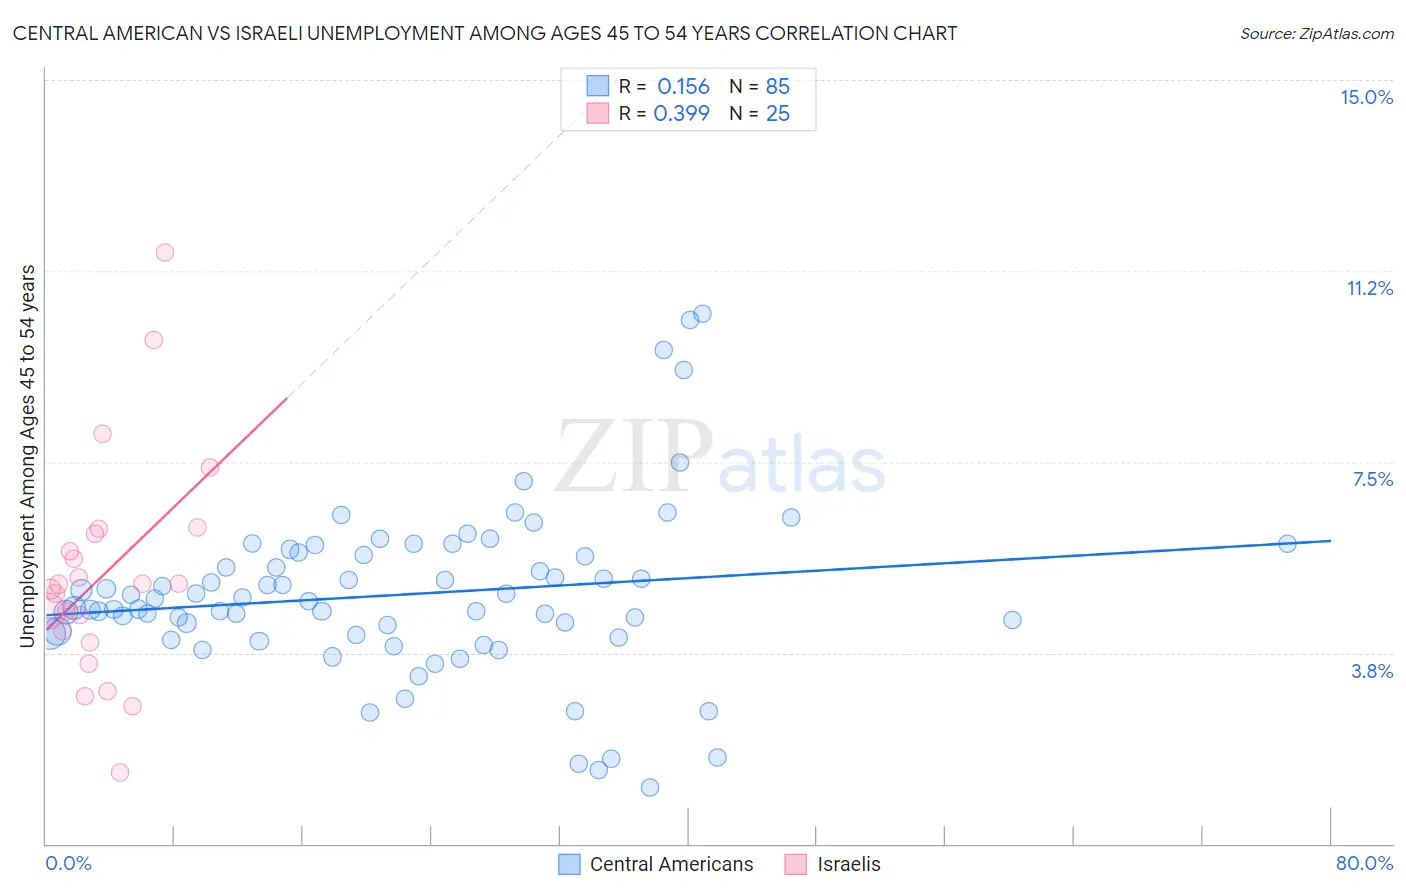
Central American vs Israeli Unemployment Among Ages 45 to 54 years Correlation Chart
The statistical analysis conducted on geographies consisting of 483,192,967 people shows a poor positive correlation between the proportion of Central Americans and unemployment rate among population between the ages 45 and 54 in the United States with a correlation coefficient (R) of 0.156 and weighted average of 4.8%. Similarly, the statistical analysis conducted on geographies consisting of 208,546,689 people shows a mild positive correlation between the proportion of Israelis and unemployment rate among population between the ages 45 and 54 in the United States with a correlation coefficient (R) of 0.399 and weighted average of 4.8%, a difference of 0.38%.
Unemployment Among Ages 45 to 54 years Correlation Summary
| Measurement | Central American | Israeli |
| Minimum | 1.1% | 1.4% |
| Maximum | 10.4% | 11.6% |
| Range | 9.3% | 10.2% |
| Mean | 4.9% | 5.3% |
| Median | 4.8% | 5.1% |
| Interquartile 25% (IQ1) | 4.1% | 4.1% |
| Interquartile 75% (IQ3) | 5.7% | 6.1% |
| Interquartile Range (IQR) | 1.6% | 2.1% |
| Standard Deviation (Sample) | 1.7% | 2.2% |
| Standard Deviation (Population) | 1.7% | 2.2% |
Demographics Similar to Central Americans and Israelis by Unemployment Among Ages 45 to 54 years
In terms of unemployment among ages 45 to 54 years, the demographic groups most similar to Central Americans are Delaware (4.8%, a difference of 0.0%), Immigrants from Iraq (4.7%, a difference of 0.070%), Yaqui (4.7%, a difference of 0.10%), Spanish American (4.7%, a difference of 0.10%), and Portuguese (4.8%, a difference of 0.11%). Similarly, the demographic groups most similar to Israelis are Immigrants from Syria (4.8%, a difference of 0.050%), Immigrants from Albania (4.8%, a difference of 0.060%), Immigrants from Liberia (4.8%, a difference of 0.11%), Seminole (4.8%, a difference of 0.21%), and Portuguese (4.8%, a difference of 0.26%).
| Demographics | Rating | Rank | Unemployment Among Ages 45 to 54 years |
| Soviet Union | 2.6 /100 | #234 | Tragic 4.7% |
| Cree | 2.3 /100 | #235 | Tragic 4.7% |
| Tlingit-Haida | 2.3 /100 | #236 | Tragic 4.7% |
| Alsatians | 1.6 /100 | #237 | Tragic 4.7% |
| Yaqui | 1.4 /100 | #238 | Tragic 4.7% |
| Spanish Americans | 1.4 /100 | #239 | Tragic 4.7% |
| Immigrants | Iraq | 1.3 /100 | #240 | Tragic 4.7% |
| Delaware | 1.3 /100 | #241 | Tragic 4.8% |
| Central Americans | 1.3 /100 | #242 | Tragic 4.8% |
| Portuguese | 1.1 /100 | #243 | Tragic 4.8% |
| Seminole | 1.1 /100 | #244 | Tragic 4.8% |
| Immigrants | Albania | 0.9 /100 | #245 | Tragic 4.8% |
| Immigrants | Syria | 0.9 /100 | #246 | Tragic 4.8% |
| Israelis | 0.9 /100 | #247 | Tragic 4.8% |
| Immigrants | Liberia | 0.8 /100 | #248 | Tragic 4.8% |
| Immigrants | Honduras | 0.7 /100 | #249 | Tragic 4.8% |
| Salvadorans | 0.7 /100 | #250 | Tragic 4.8% |
| Hondurans | 0.4 /100 | #251 | Tragic 4.8% |
| Immigrants | Bahamas | 0.3 /100 | #252 | Tragic 4.8% |
| Moroccans | 0.3 /100 | #253 | Tragic 4.8% |
| Immigrants | Lebanon | 0.2 /100 | #254 | Tragic 4.8% |