Central American vs Immigrants from Croatia Unemployment Among Ages 65 to 74 years
COMPARE
Central American
Immigrants from Croatia
Unemployment Among Ages 65 to 74 years
Unemployment Among Ages 65 to 74 years Comparison
Central Americans
Immigrants from Croatia
5.7%
UNEMPLOYMENT AMONG AGES 65 TO 74 YEARS
0.0/ 100
METRIC RATING
288th/ 347
METRIC RANK
5.5%
UNEMPLOYMENT AMONG AGES 65 TO 74 YEARS
9.1/ 100
METRIC RATING
211th/ 347
METRIC RANK
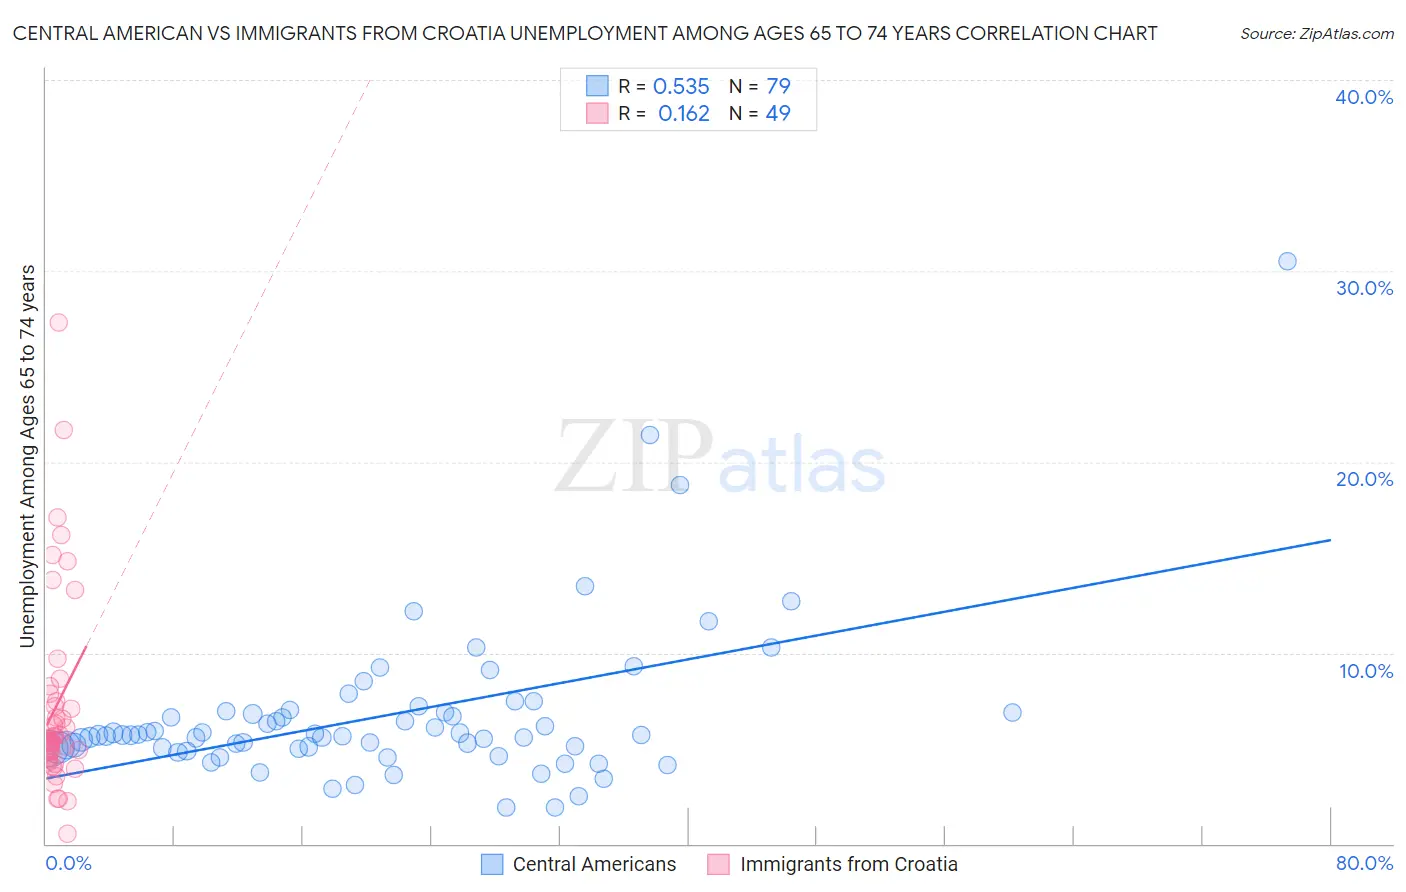
Central American vs Immigrants from Croatia Unemployment Among Ages 65 to 74 years Correlation Chart
The statistical analysis conducted on geographies consisting of 420,132,687 people shows a substantial positive correlation between the proportion of Central Americans and unemployment rate among population between the ages 65 and 74 in the United States with a correlation coefficient (R) of 0.535 and weighted average of 5.7%. Similarly, the statistical analysis conducted on geographies consisting of 125,935,712 people shows a poor positive correlation between the proportion of Immigrants from Croatia and unemployment rate among population between the ages 65 and 74 in the United States with a correlation coefficient (R) of 0.162 and weighted average of 5.5%, a difference of 4.8%.
Unemployment Among Ages 65 to 74 years Correlation Summary
| Measurement | Central American | Immigrants from Croatia |
| Minimum | 1.9% | 0.50% |
| Maximum | 30.5% | 27.3% |
| Range | 28.6% | 26.8% |
| Mean | 6.7% | 7.2% |
| Median | 5.7% | 5.4% |
| Interquartile 25% (IQ1) | 5.0% | 4.5% |
| Interquartile 75% (IQ3) | 6.9% | 7.6% |
| Interquartile Range (IQR) | 1.9% | 3.2% |
| Standard Deviation (Sample) | 4.2% | 5.2% |
| Standard Deviation (Population) | 4.1% | 5.1% |
Similar Demographics by Unemployment Among Ages 65 to 74 years
Demographics Similar to Central Americans by Unemployment Among Ages 65 to 74 years
In terms of unemployment among ages 65 to 74 years, the demographic groups most similar to Central Americans are Immigrants from Somalia (5.7%, a difference of 0.0%), Spanish American Indian (5.7%, a difference of 0.26%), Portuguese (5.7%, a difference of 0.30%), Central American Indian (5.7%, a difference of 0.44%), and Marshallese (5.7%, a difference of 0.52%).
| Demographics | Rating | Rank | Unemployment Among Ages 65 to 74 years |
| Immigrants | West Indies | 0.1 /100 | #281 | Tragic 5.7% |
| Ottawa | 0.1 /100 | #282 | Tragic 5.7% |
| Cypriots | 0.1 /100 | #283 | Tragic 5.7% |
| Chippewa | 0.1 /100 | #284 | Tragic 5.7% |
| Immigrants | Sierra Leone | 0.1 /100 | #285 | Tragic 5.7% |
| Marshallese | 0.1 /100 | #286 | Tragic 5.7% |
| Central American Indians | 0.0 /100 | #287 | Tragic 5.7% |
| Central Americans | 0.0 /100 | #288 | Tragic 5.7% |
| Immigrants | Somalia | 0.0 /100 | #289 | Tragic 5.7% |
| Spanish American Indians | 0.0 /100 | #290 | Tragic 5.7% |
| Portuguese | 0.0 /100 | #291 | Tragic 5.7% |
| U.S. Virgin Islanders | 0.0 /100 | #292 | Tragic 5.8% |
| Immigrants | Grenada | 0.0 /100 | #293 | Tragic 5.8% |
| Immigrants | Morocco | 0.0 /100 | #294 | Tragic 5.8% |
| Blacks/African Americans | 0.0 /100 | #295 | Tragic 5.8% |
Demographics Similar to Immigrants from Croatia by Unemployment Among Ages 65 to 74 years
In terms of unemployment among ages 65 to 74 years, the demographic groups most similar to Immigrants from Croatia are Immigrants from Northern Africa (5.5%, a difference of 0.10%), Immigrants from Honduras (5.5%, a difference of 0.12%), Haitian (5.5%, a difference of 0.14%), Italian (5.5%, a difference of 0.15%), and Egyptian (5.5%, a difference of 0.15%).
| Demographics | Rating | Rank | Unemployment Among Ages 65 to 74 years |
| Seminole | 14.3 /100 | #204 | Poor 5.4% |
| Icelanders | 14.2 /100 | #205 | Poor 5.4% |
| Africans | 12.8 /100 | #206 | Poor 5.5% |
| Immigrants | Uzbekistan | 12.5 /100 | #207 | Poor 5.5% |
| Dutch West Indians | 11.5 /100 | #208 | Poor 5.5% |
| Immigrants | Honduras | 10.4 /100 | #209 | Poor 5.5% |
| Immigrants | Northern Africa | 10.1 /100 | #210 | Poor 5.5% |
| Immigrants | Croatia | 9.1 /100 | #211 | Tragic 5.5% |
| Haitians | 7.7 /100 | #212 | Tragic 5.5% |
| Italians | 7.7 /100 | #213 | Tragic 5.5% |
| Egyptians | 7.6 /100 | #214 | Tragic 5.5% |
| Americans | 7.3 /100 | #215 | Tragic 5.5% |
| Uruguayans | 6.2 /100 | #216 | Tragic 5.5% |
| Blackfeet | 5.8 /100 | #217 | Tragic 5.5% |
| Samoans | 5.7 /100 | #218 | Tragic 5.5% |