Celtic vs South American Indian Unemployment Among Ages 16 to 19 years

COMPARE

Celtic
Race
Ancestry
AfghanAfricanAlaska NativeAlaskan AthabascanAlbanianAleutAlsatianAmericanApacheArabArapahoArgentineanArmenianAssyrian/Chaldean/SyriacAustralianAustrianBahamianBangladeshiBarbadianBasqueBelgianBelizeanBermudanBhutaneseBlackfeetBolivianBrazilianBritishBritish West IndianBulgarianBurmeseCajunCambodianCanadianCape VerdeanCarpatho RusynCelticCentral AmericanCentral American IndianCherokeeCheyenneChickasawChileanChineseChippewaChoctawColombianColvilleComancheCosta RicanCreeCreekCroatianCrowCubanCypriotCzechCzechoslovakianDanishDelawareDominicanDutchDutch West IndianEastern EuropeanEcuadorianEgyptianEnglishEstonianEthiopianEuropeanFijianFilipinoFinnishFrenchFrench American IndianFrench CanadianGermanGerman RussianGhanaianGreekGuamanian/ChamorroGuatemalanGuyaneseHaitianHmongHonduranHopiHoumaHungarianIcelanderIndian (Asian)IndonesianInupiatIranianIraqiIrishIroquoisIsraeliItalianJamaicanJapaneseJordanianKenyanKiowaKoreanLaotianLatvianLebaneseLiberianLithuanianLumbeeLuxembourgerMacedonianMalaysianMalteseMarshalleseMenomineeMexicanMexican American IndianMongolianMoroccanNative HawaiianNavajoNepaleseNew ZealanderNicaraguanNigerianNorthern EuropeanNorwegianOkinawanOsageOttawaPaiutePakistaniPalestinianPanamanianParaguayanPennsylvania GermanPeruvianPimaPolishPortuguesePotawatomiPuebloPuerto RicanPuget Sound SalishRomanianRussianSalvadoranSamoanScandinavianScotch-IrishScottishSeminoleSenegaleseSerbianShoshoneSierra LeoneanSiouxSlavicSlovakSloveneSomaliSouth AfricanSouth AmericanSoviet UnionSpaniardSpanishSpanish AmericanSpanish American IndianSri LankanSubsaharan AfricanSudaneseSwedishSwissSyrianTaiwaneseThaiTlingit-HaidaTohono O'OdhamTonganTrinidadian and TobagonianTsimshianTurkishU.S. Virgin IslanderUgandanUkrainianUruguayanUteVenezuelanVietnameseWelshWest IndianYakamaYaquiYugoslavianYumanYup'ikZimbabwean
Immigration
NonimmigrantsImmigrantsAfghanistanAfricaAlbaniaArgentinaArmeniaAsiaAustraliaAustriaBahamasBangladeshBarbadosBelarusBelgiumBelizeBoliviaBosnia and HerzegovinaBrazilBulgariaBurma/MyanmarCabo VerdeCambodiaCameroonCanadaCaribbeanCentral AmericaChileChinaColombiaCongoCosta RicaCroatiaCubaCzechoslovakiaDenmarkDominicaDominican RepublicEastern AfricaEastern AsiaEastern EuropeEcuadorEgyptEl SalvadorEnglandEritreaEthiopiaEuropeFijiFranceGermanyGhanaGreeceGrenadaGuatemalaGuyanaHaitiHondurasHong KongHungaryIndiaIndonesiaIranIraqIrelandIsraelItalyJamaicaJapanJordanKazakhstanKenyaKoreaKuwaitLaosLatin AmericaLatviaLebanonLiberiaLithuaniaMalaysiaMexicoMicronesiaMiddle AfricaMoldovaMoroccoNepalNetherlandsNicaraguaNigeriaNorth AmericaNorth MacedoniaNorthern AfricaNorthern EuropeNorwayOceaniaPakistanPanamaPeruPhilippinesPolandPortugalRomaniaRussiaSaudi ArabiaScotlandSenegalSerbiaSierra LeoneSingaporeSomaliaSouth AfricaSouth AmericaSouth Central AsiaSouth Eastern AsiaSouthern EuropeSpainSri LankaSt. Vincent and the GrenadinesSudanSwedenSwitzerlandSyriaTaiwanThailandTrinidad and TobagoTurkeyUgandaUkraineUruguayUzbekistanVenezuelaVietnamWest IndiesWestern AfricaWestern AsiaWestern EuropeYemenZaireZimbabweAzores
South American Indian
Race
Ancestry
AfghanAfricanAlaska NativeAlaskan AthabascanAlbanianAleutAlsatianAmericanApacheArabArapahoArgentineanArmenianAssyrian/Chaldean/SyriacAustralianAustrianBahamianBangladeshiBarbadianBasqueBelgianBelizeanBermudanBhutaneseBlackfeetBolivianBrazilianBritishBritish West IndianBulgarianBurmeseCajunCambodianCanadianCape VerdeanCarpatho RusynCentral AmericanCentral American IndianCherokeeCheyenneChickasawChileanChineseChippewaChoctawColombianColvilleComancheCosta RicanCreeCreekCroatianCrowCubanCypriotCzechCzechoslovakianDanishDelawareDominicanDutchDutch West IndianEastern EuropeanEcuadorianEgyptianEnglishEstonianEthiopianEuropeanFijianFilipinoFinnishFrenchFrench American IndianFrench CanadianGermanGerman RussianGhanaianGreekGuamanian/ChamorroGuatemalanGuyaneseHaitianHmongHonduranHopiHoumaHungarianIcelanderIndian (Asian)IndonesianInupiatIranianIraqiIrishIroquoisIsraeliItalianJamaicanJapaneseJordanianKenyanKiowaKoreanLaotianLatvianLebaneseLiberianLithuanianLumbeeLuxembourgerMacedonianMalaysianMalteseMarshalleseMenomineeMexicanMexican American IndianMongolianMoroccanNative HawaiianNavajoNepaleseNew ZealanderNicaraguanNigerianNorthern EuropeanNorwegianOkinawanOsageOttawaPaiutePakistaniPalestinianPanamanianParaguayanPennsylvania GermanPeruvianPimaPolishPortuguesePotawatomiPuebloPuerto RicanPuget Sound SalishRomanianRussianSalvadoranSamoanScandinavianScotch-IrishScottishSeminoleSenegaleseSerbianShoshoneSierra LeoneanSiouxSlavicSlovakSloveneSomaliSouth AfricanSouth AmericanSouth American IndianSoviet UnionSpaniardSpanishSpanish AmericanSpanish American IndianSri LankanSubsaharan AfricanSudaneseSwedishSwissSyrianTaiwaneseThaiTlingit-HaidaTohono O'OdhamTonganTrinidadian and TobagonianTsimshianTurkishU.S. Virgin IslanderUgandanUkrainianUruguayanUteVenezuelanVietnameseWelshWest IndianYakamaYaquiYugoslavianYumanYup'ikZimbabwean
Immigration
NonimmigrantsImmigrantsAfghanistanAfricaAlbaniaArgentinaArmeniaAsiaAustraliaAustriaBahamasBangladeshBarbadosBelarusBelgiumBelizeBoliviaBosnia and HerzegovinaBrazilBulgariaBurma/MyanmarCabo VerdeCambodiaCameroonCanadaCaribbeanCentral AmericaChileChinaColombiaCongoCosta RicaCroatiaCubaCzechoslovakiaDenmarkDominicaDominican RepublicEastern AfricaEastern AsiaEastern EuropeEcuadorEgyptEl SalvadorEnglandEritreaEthiopiaEuropeFijiFranceGermanyGhanaGreeceGrenadaGuatemalaGuyanaHaitiHondurasHong KongHungaryIndiaIndonesiaIranIraqIrelandIsraelItalyJamaicaJapanJordanKazakhstanKenyaKoreaKuwaitLaosLatin AmericaLatviaLebanonLiberiaLithuaniaMalaysiaMexicoMicronesiaMiddle AfricaMoldovaMoroccoNepalNetherlandsNicaraguaNigeriaNorth AmericaNorth MacedoniaNorthern AfricaNorthern EuropeNorwayOceaniaPakistanPanamaPeruPhilippinesPolandPortugalRomaniaRussiaSaudi ArabiaScotlandSenegalSerbiaSierra LeoneSingaporeSomaliaSouth AfricaSouth AmericaSouth Central AsiaSouth Eastern AsiaSouthern EuropeSpainSri LankaSt. Vincent and the GrenadinesSudanSwedenSwitzerlandSyriaTaiwanThailandTrinidad and TobagoTurkeyUgandaUkraineUruguayUzbekistanVenezuelaVietnamWest IndiesWestern AfricaWestern AsiaWestern EuropeYemenZaireZimbabweAzores
Unemployment Among Ages 16 to 19 years
Income
Poverty
Unemployment
Labor Participation
Family Structure
Vehicle Availability
Education Level
Disability

Unemployment Among Ages 16 to 19 years Comparison

Celtics

South American Indians

Average
Poor
17.6%
UNEMPLOYMENT AMONG AGES 16 TO 19 YEARS
48.7/ 100
METRIC RATING
178th/ 347
METRIC RANK
18.0%
UNEMPLOYMENT AMONG AGES 16 TO 19 YEARS
13.0/ 100
METRIC RATING
217th/ 347
METRIC RANK

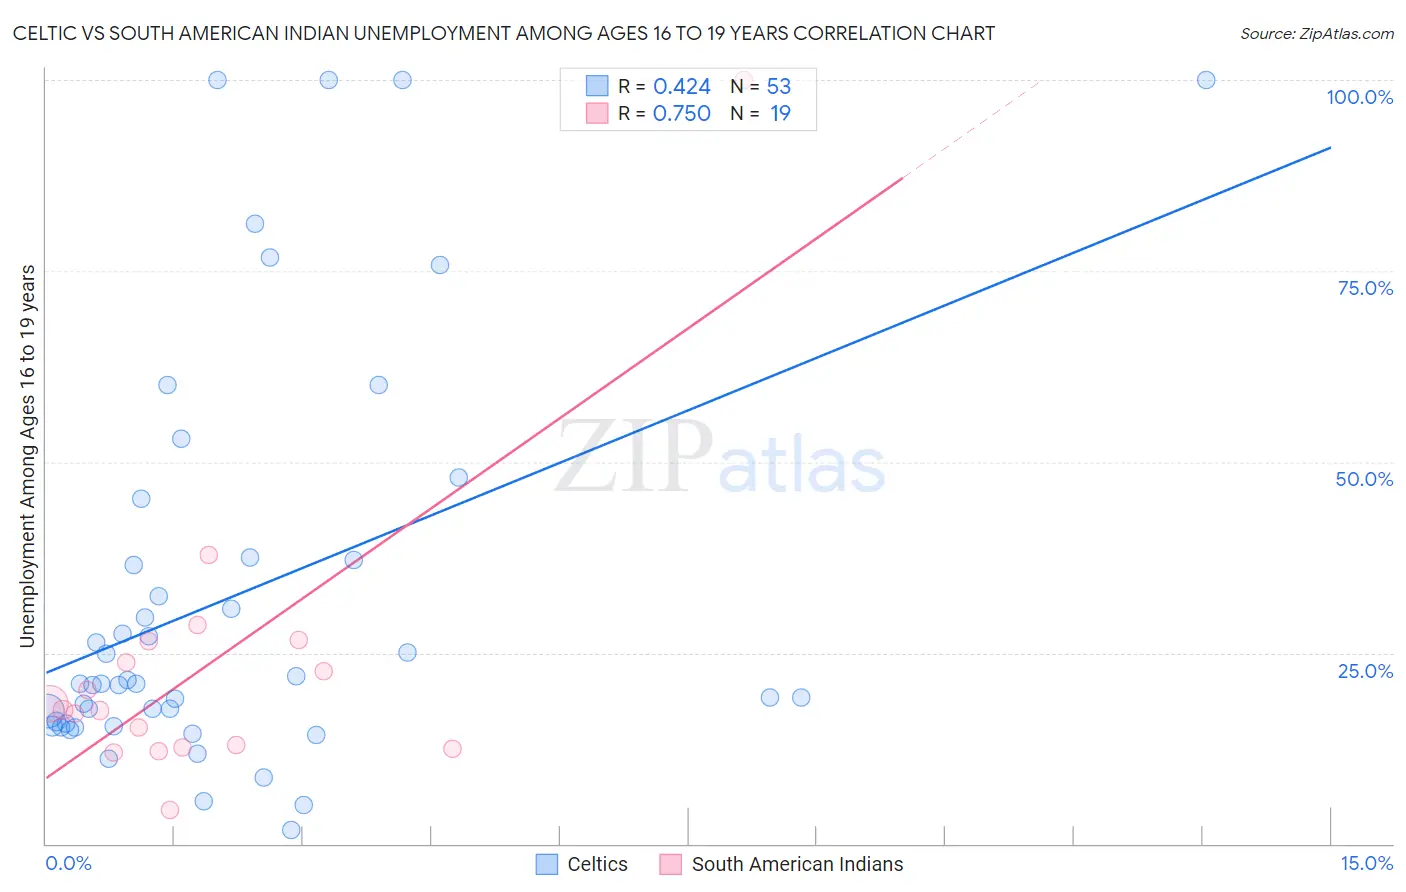
Celtic vs South American Indian Unemployment Among Ages 16 to 19 years Correlation Chart

The statistical analysis conducted on geographies consisting of 163,923,986 people shows a moderate positive correlation between the proportion of Celtics and unemployment rate among population between the ages 16 and 19 in the United States with a correlation coefficient (R) of 0.424 and weighted average of 17.6%. Similarly, the statistical analysis conducted on geographies consisting of 161,523,543 people shows a strong positive correlation between the proportion of South American Indians and unemployment rate among population between the ages 16 and 19 in the United States with a correlation coefficient (R) of 0.750 and weighted average of 18.0%, a difference of 2.2%.
Celtic vs South American Indian Unemployment Among Ages 16 to 19 years

Unemployment Among Ages 16 to 19 years Correlation Summary

MeasurementCelticSouth American Indian
Minimum1.8%4.5%
Maximum100.0%100.0%
Range98.2%95.5%
Mean32.2%23.1%
Median21.0%17.5%
Interquartile 25% (IQ1)15.6%12.6%
Interquartile 75% (IQ3)37.3%26.5%
Interquartile Range (IQR)21.7%13.9%
Standard Deviation (Sample)26.4%20.1%
Standard Deviation (Population)26.1%19.6%

Similar Demographics by Unemployment Among Ages 16 to 19 years

Demographics Similar to Celtics by Unemployment Among Ages 16 to 19 years

In terms of unemployment among ages 16 to 19 years, the demographic groups most similar to Celtics are Bermudan (17.6%, a difference of 0.0%), Nicaraguan (17.6%, a difference of 0.010%), Immigrants from Sweden (17.6%, a difference of 0.020%), Osage (17.6%, a difference of 0.060%), and American (17.6%, a difference of 0.060%).
DemographicsRating | RankUnemployment Among Ages 16 to 19 years
Immigrants | Switzerland
53.2
/100
|
#171
Average
17.5%
Immigrants | Western Europe
52.2
/100
|
#172
Average
17.6%
Chileans
50.8
/100
|
#173
Average
17.6%
Osage
50.0
/100
|
#174
Average
17.6%
Immigrants | Sweden
49.1
/100
|
#175
Average
17.6%
Nicaraguans
48.9
/100
|
#176
Average
17.6%
Bermudans
48.7
/100
|
#177
Average
17.6%
Celtics
48.7
/100
|
#178
Average
17.6%
Americans
47.4
/100
|
#179
Average
17.6%
Spaniards
47.1
/100
|
#180
Average
17.6%
Immigrants | Turkey
45.6
/100
|
#181
Average
17.6%
Russians
45.2
/100
|
#182
Average
17.6%
Immigrants | Uruguay
44.6
/100
|
#183
Average
17.6%
Eastern Europeans
44.3
/100
|
#184
Average
17.6%
Iroquois
43.4
/100
|
#185
Average
17.6%

Demographics Similar to South American Indians by Unemployment Among Ages 16 to 19 years

In terms of unemployment among ages 16 to 19 years, the demographic groups most similar to South American Indians are Immigrants from Kazakhstan (18.0%, a difference of 0.0%), Immigrants from Syria (18.0%, a difference of 0.040%), Immigrants from Argentina (18.0%, a difference of 0.050%), Immigrants from Morocco (18.0%, a difference of 0.060%), and Chippewa (18.0%, a difference of 0.080%).
DemographicsRating | RankUnemployment Among Ages 16 to 19 years
Carpatho Rusyns
15.6
/100
|
#210
Poor
17.9%
Guamanians/Chamorros
14.5
/100
|
#211
Poor
17.9%
Argentineans
13.8
/100
|
#212
Poor
18.0%
Chippewa
13.7
/100
|
#213
Poor
18.0%
Immigrants | Morocco
13.5
/100
|
#214
Poor
18.0%
Immigrants | Syria
13.3
/100
|
#215
Poor
18.0%
Immigrants | Kazakhstan
13.0
/100
|
#216
Poor
18.0%
South American Indians
13.0
/100
|
#217
Poor
18.0%
Immigrants | Argentina
12.5
/100
|
#218
Poor
18.0%
Immigrants | Africa
12.0
/100
|
#219
Poor
18.0%
Immigrants | Albania
11.4
/100
|
#220
Poor
18.0%
Immigrants | Spain
11.4
/100
|
#221
Poor
18.0%
Immigrants | Iran
10.7
/100
|
#222
Poor
18.0%
Immigrants | Western Asia
10.2
/100
|
#223
Poor
18.0%
Immigrants | Serbia
8.3
/100
|
#224
Tragic
18.1%